Talking with investors, we understand that there has rarely been such an uncertainty about what market should do. Most investors are very skeptical of the 2023 rise in equities for many reasons: high inflation, coming recession, debt ceiling, Quantitative tightening, high valuation, low breadth. At the same time, the S&P500 and MSCI World are on the edge of a major breakout.
We thought it could be useful to provide the outputs of our quantitative tools to get a few responses:
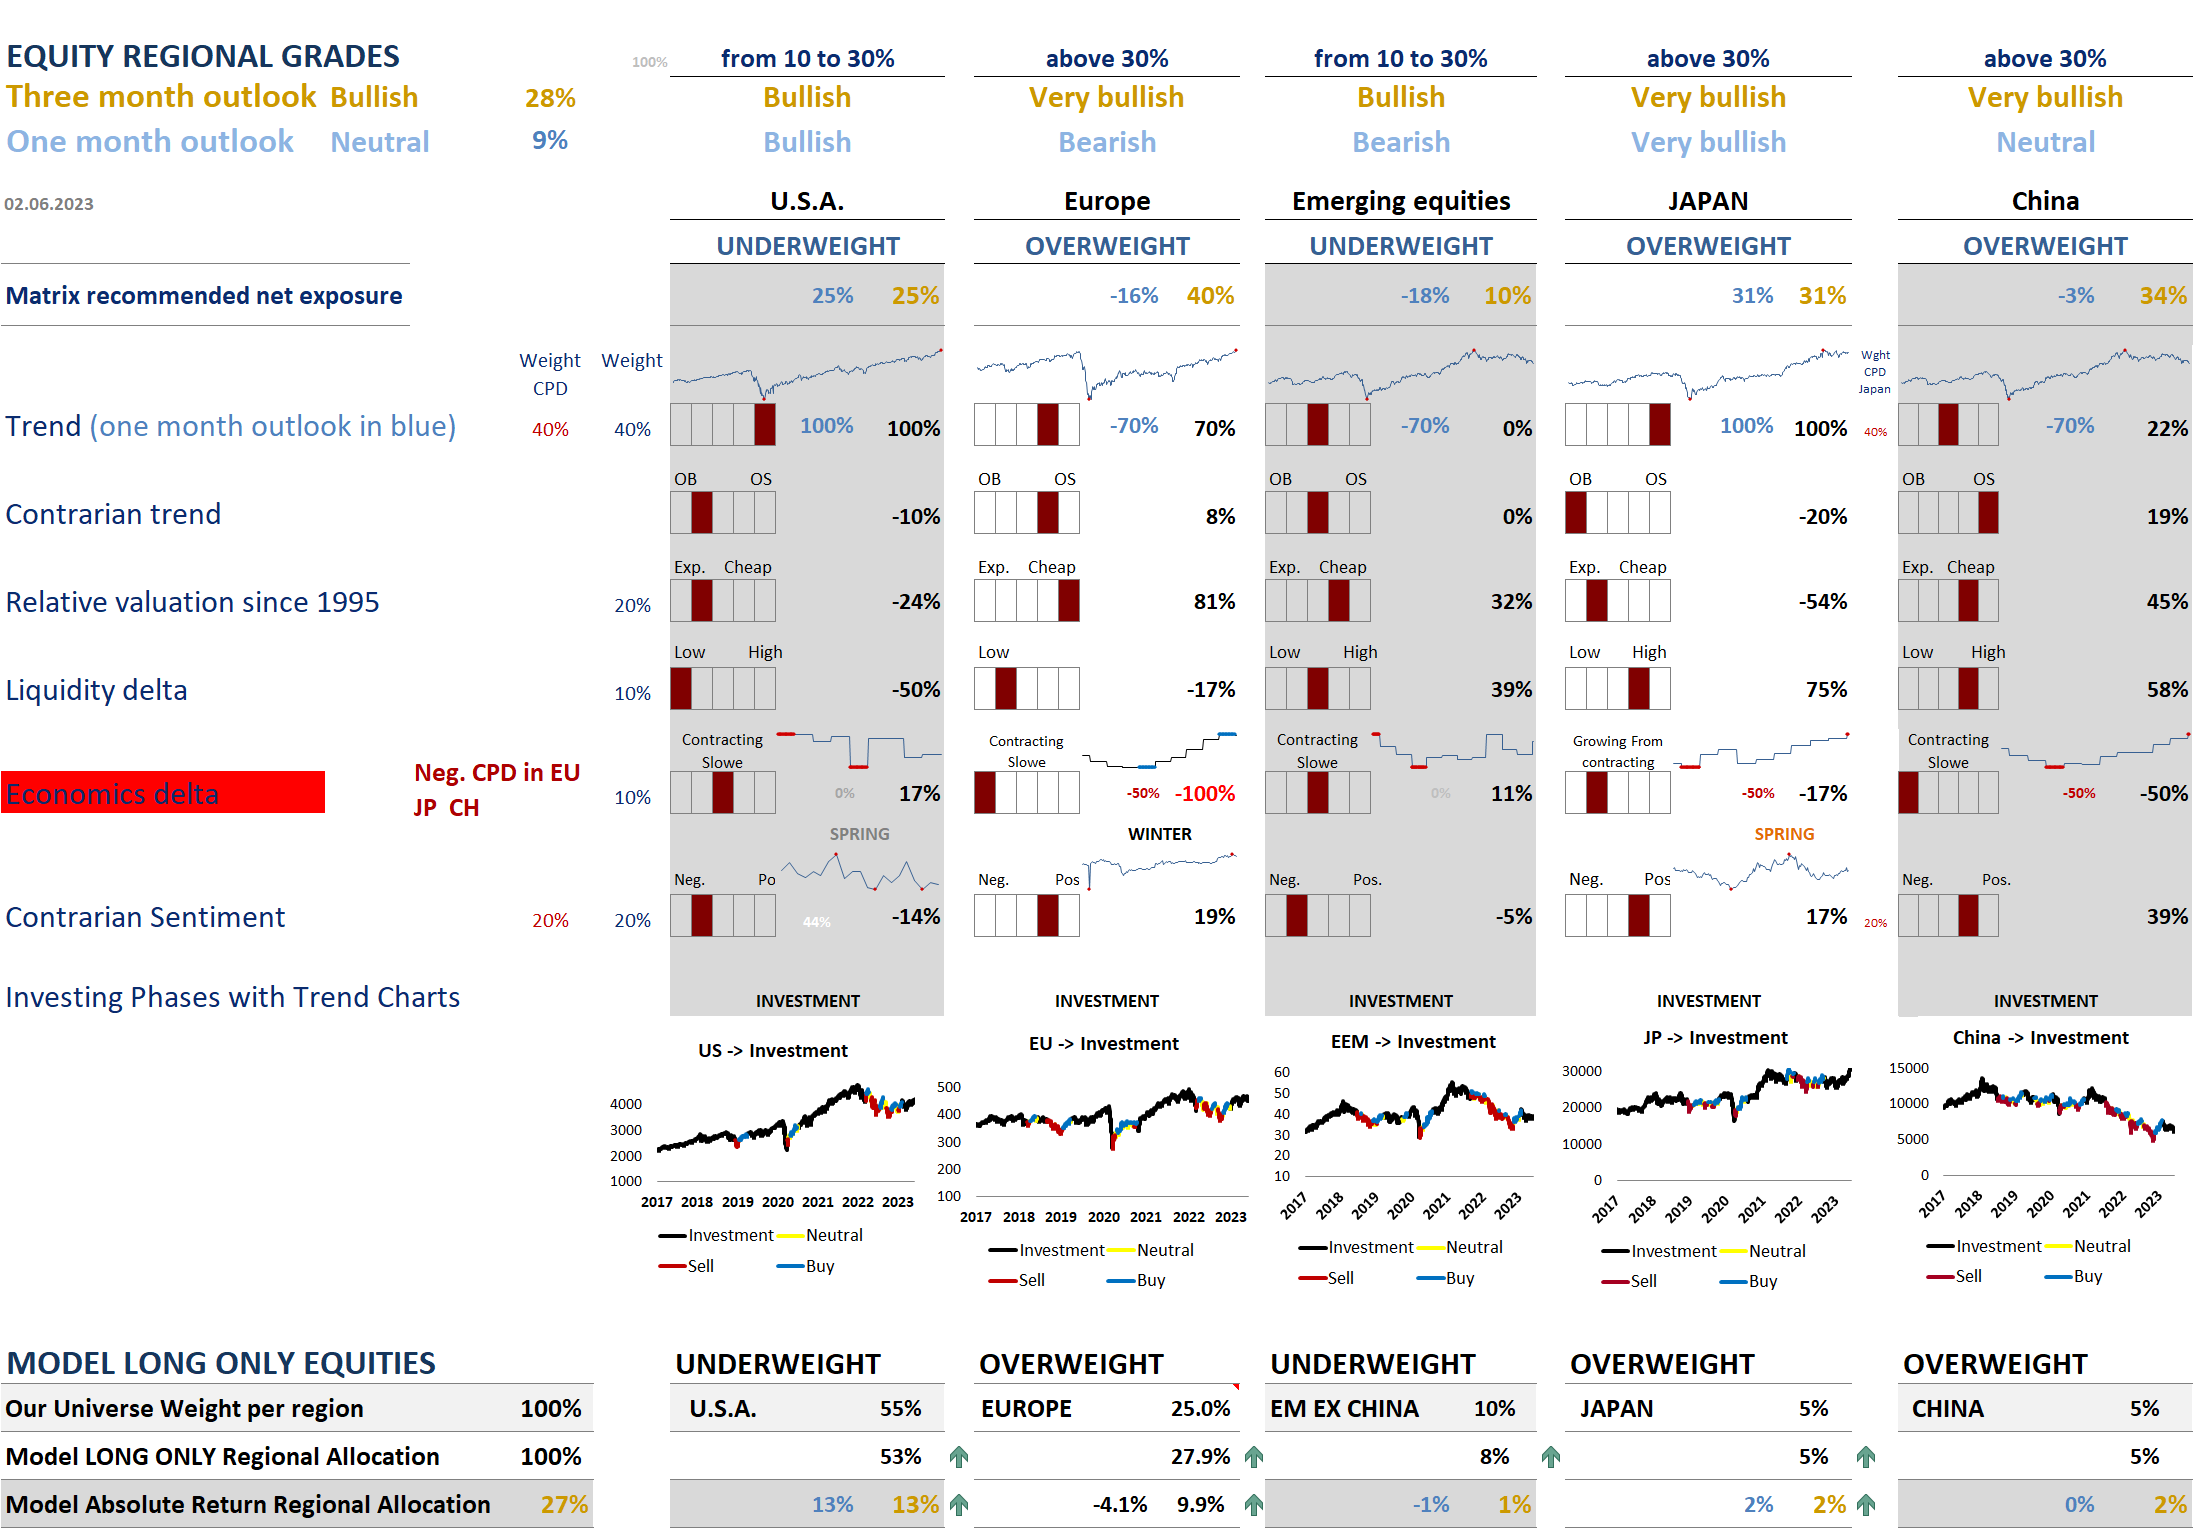
- Our regional matrix is recommanding to be bullish for all regions. This is in line with other quants that have been buying stocks while mainstream investors have stayed on the sidelines.
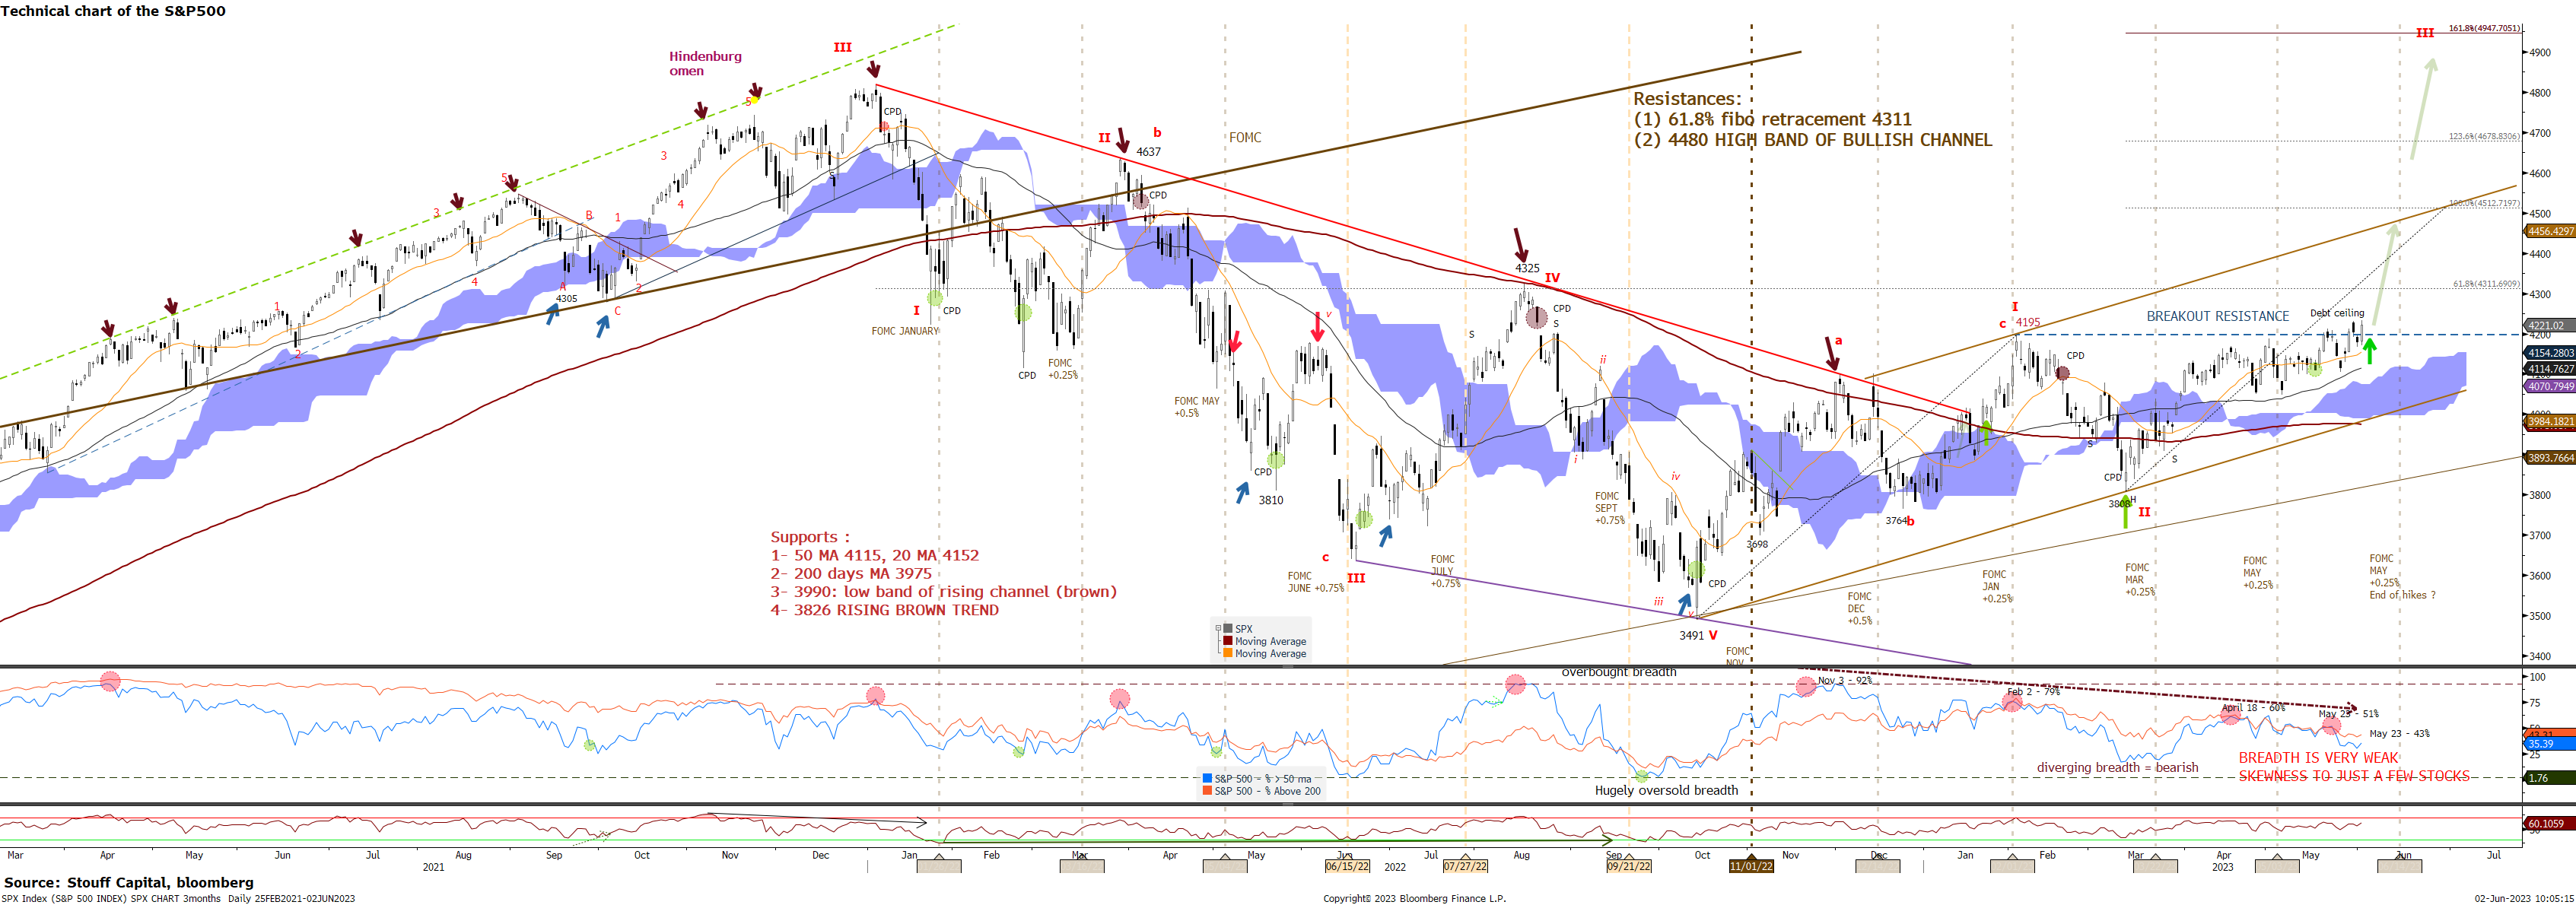
- This constructive positioning is justified by technical charts showing that indexes are near a breakout level.
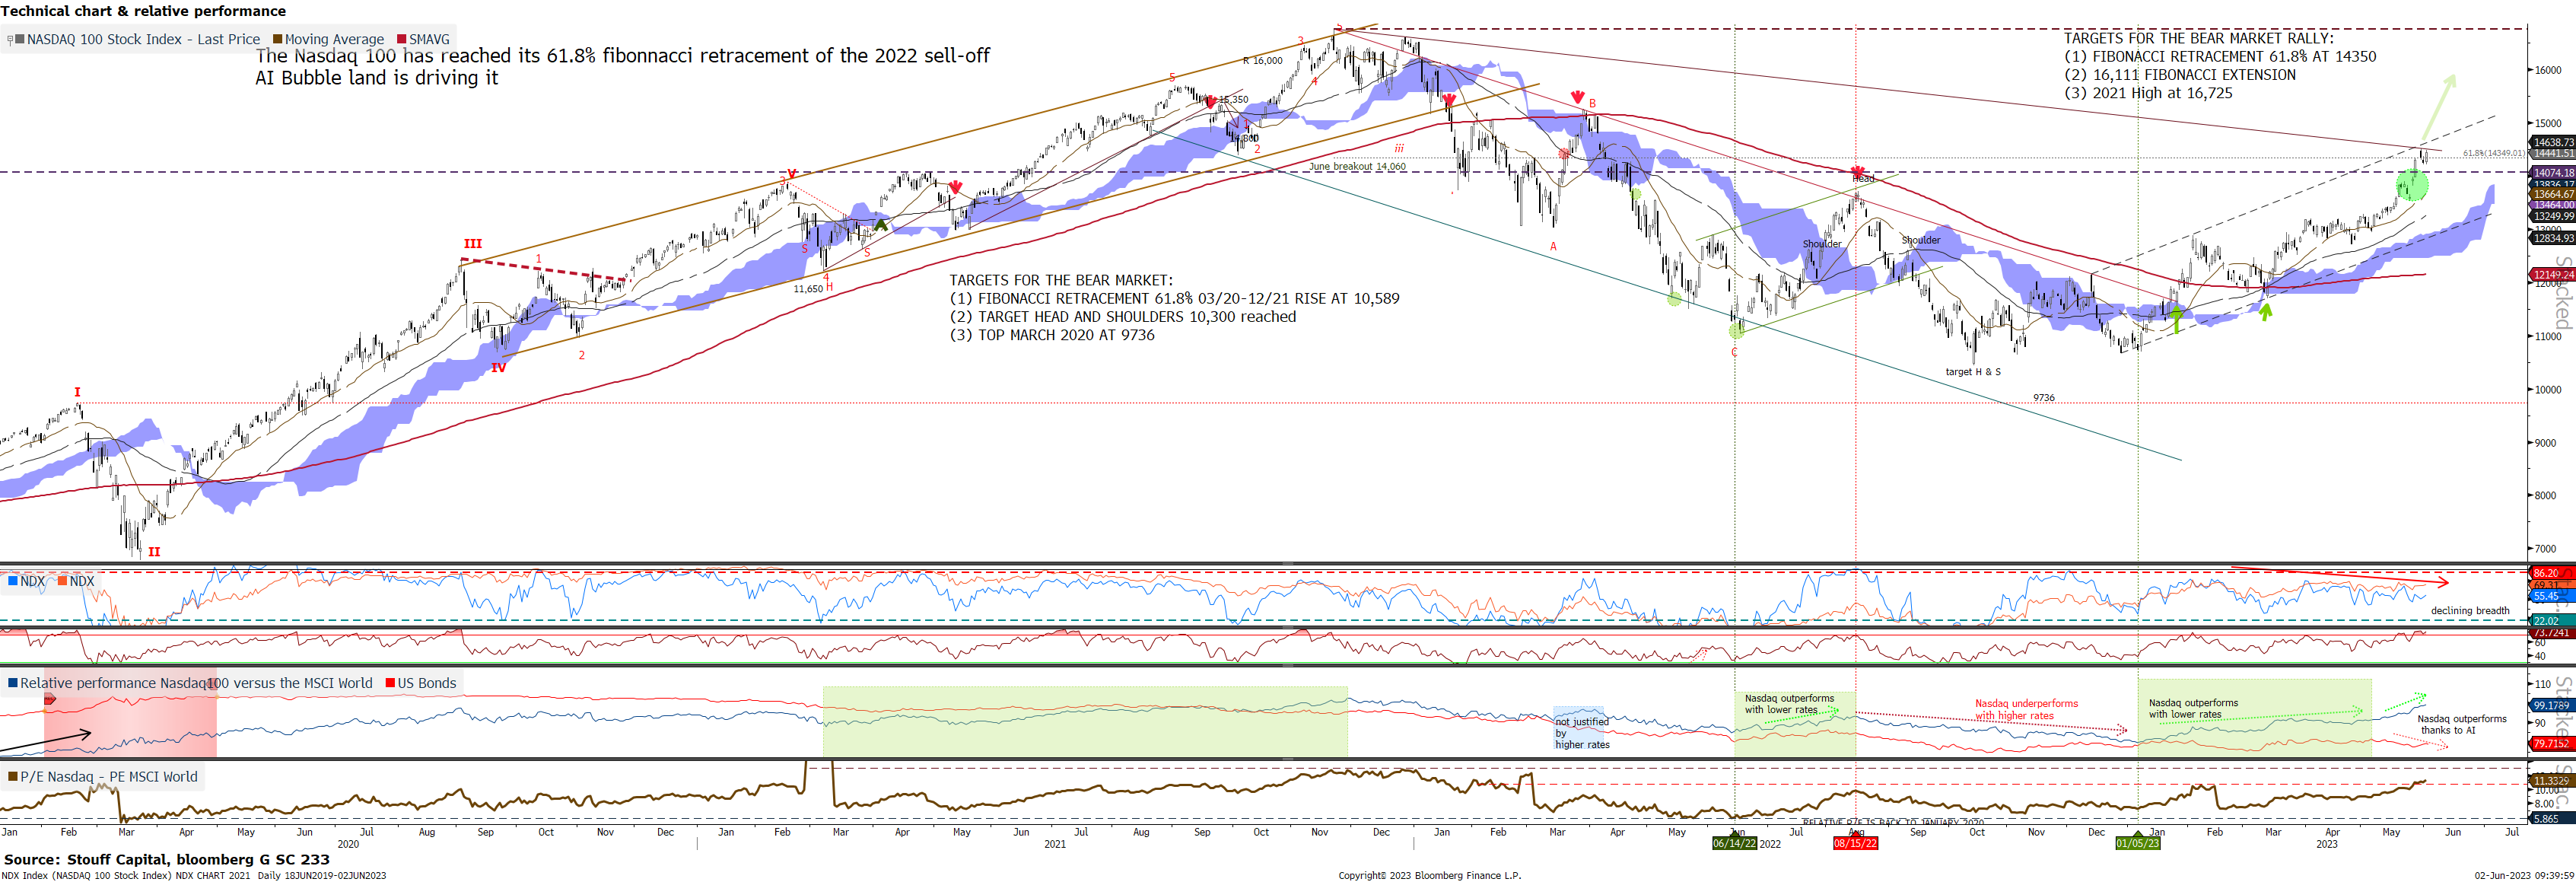
- Our Sector matrix favors TMT (Technology and Communication) in 2023: this is confirmed by the outperformance of the Nasdaq100 (chart 1) versus the rest of the world. It is underweight Financials, Energy and Materials, sectors directly linked to the economy.
- Our fractal analysis on the debt ceiling identifies a theme to play if it is resolved: buy the “Debt Ceiling Losers” basket.
- While China reopening has felt like a clouded dream for months, it has not been a straight line with many pauses and pivots: The overall bullish direction should provide a buy for global demand – perhaps we are finally seeing light at the end of the tunnel.
While markets were torn between 2 headwinds: inflation, and recession, the Debt Ceiling was the market focus, which is now solved… We recommended to initiate a straddle on the S&P500 to be hedged against the worst. That strategy also helps us being fully invested as indexes breakup their 12 months range: indeed, a straddle enables to be net short if the S&P500 falls hard but also to be fully invested above our strike. Moreover, the debt ceiling resolution would favor the “Debt Ceiling Losers” basket that has massively underperformed.
There are so many contradictions right now that it seems unthinkable that we may have started a new bull market. But for the sake of the argument, many issues could be solved: soft landing instead of a recession, with inflation slowly but surely falling to 3 not 2%, P/E falling as 2024 earnings are up to 240-250, continuity of the AI bubble (“we are in 98 not 2000” argument), better breadth with financials and cyclical sectors like energy and materials recouping their correction or may be like in the end 1998-2000, the market never broadened. Then, the argument of crashing liquidity after the debt ceiling deal may be overblown as there is ample excess reserve on banks’ balance sheets, Treasury would smooth out bill, and there is no proven causal link banks use reserves to buy equities.
Chart 1: Nasdaq100 – NDX (panel 1), % Stocks > 50 & 200days MA (panel 2), RSI (panel 3), Relative return versus the MSCI World and bonds (panel 4), Relative P/E (panel 5)
Let’s start with point 1, our top-down quantitative tool, denominated the regional matrix recommands to be bullish on the medium run for all regions. The table below shows its reading as of June 02nd. This tool gives what should be the next exposure of all our trades for the coming 3 months. It is based on a mix of constructive pillars. The first and most important of them (40% of the calculation) is the Trend grade, based on various moving averages crossovers and their respective slopes. All those regional trend grades are either maximum bullish at 100% (USA, Japan) or bullish at +70% for Europe and neutral for EM & China.
Table 1: EQUITY REGIONAL MATRIX – 02.06.23
The below chart of the S&P500 confirms the bullish state of US equities. We observe an elliott wave pattern with a wave 3 target at 4947:
Chart 2: TRADING PLAN FOR THE S&P500 – towards 4512, then 4950 – 02.06.23
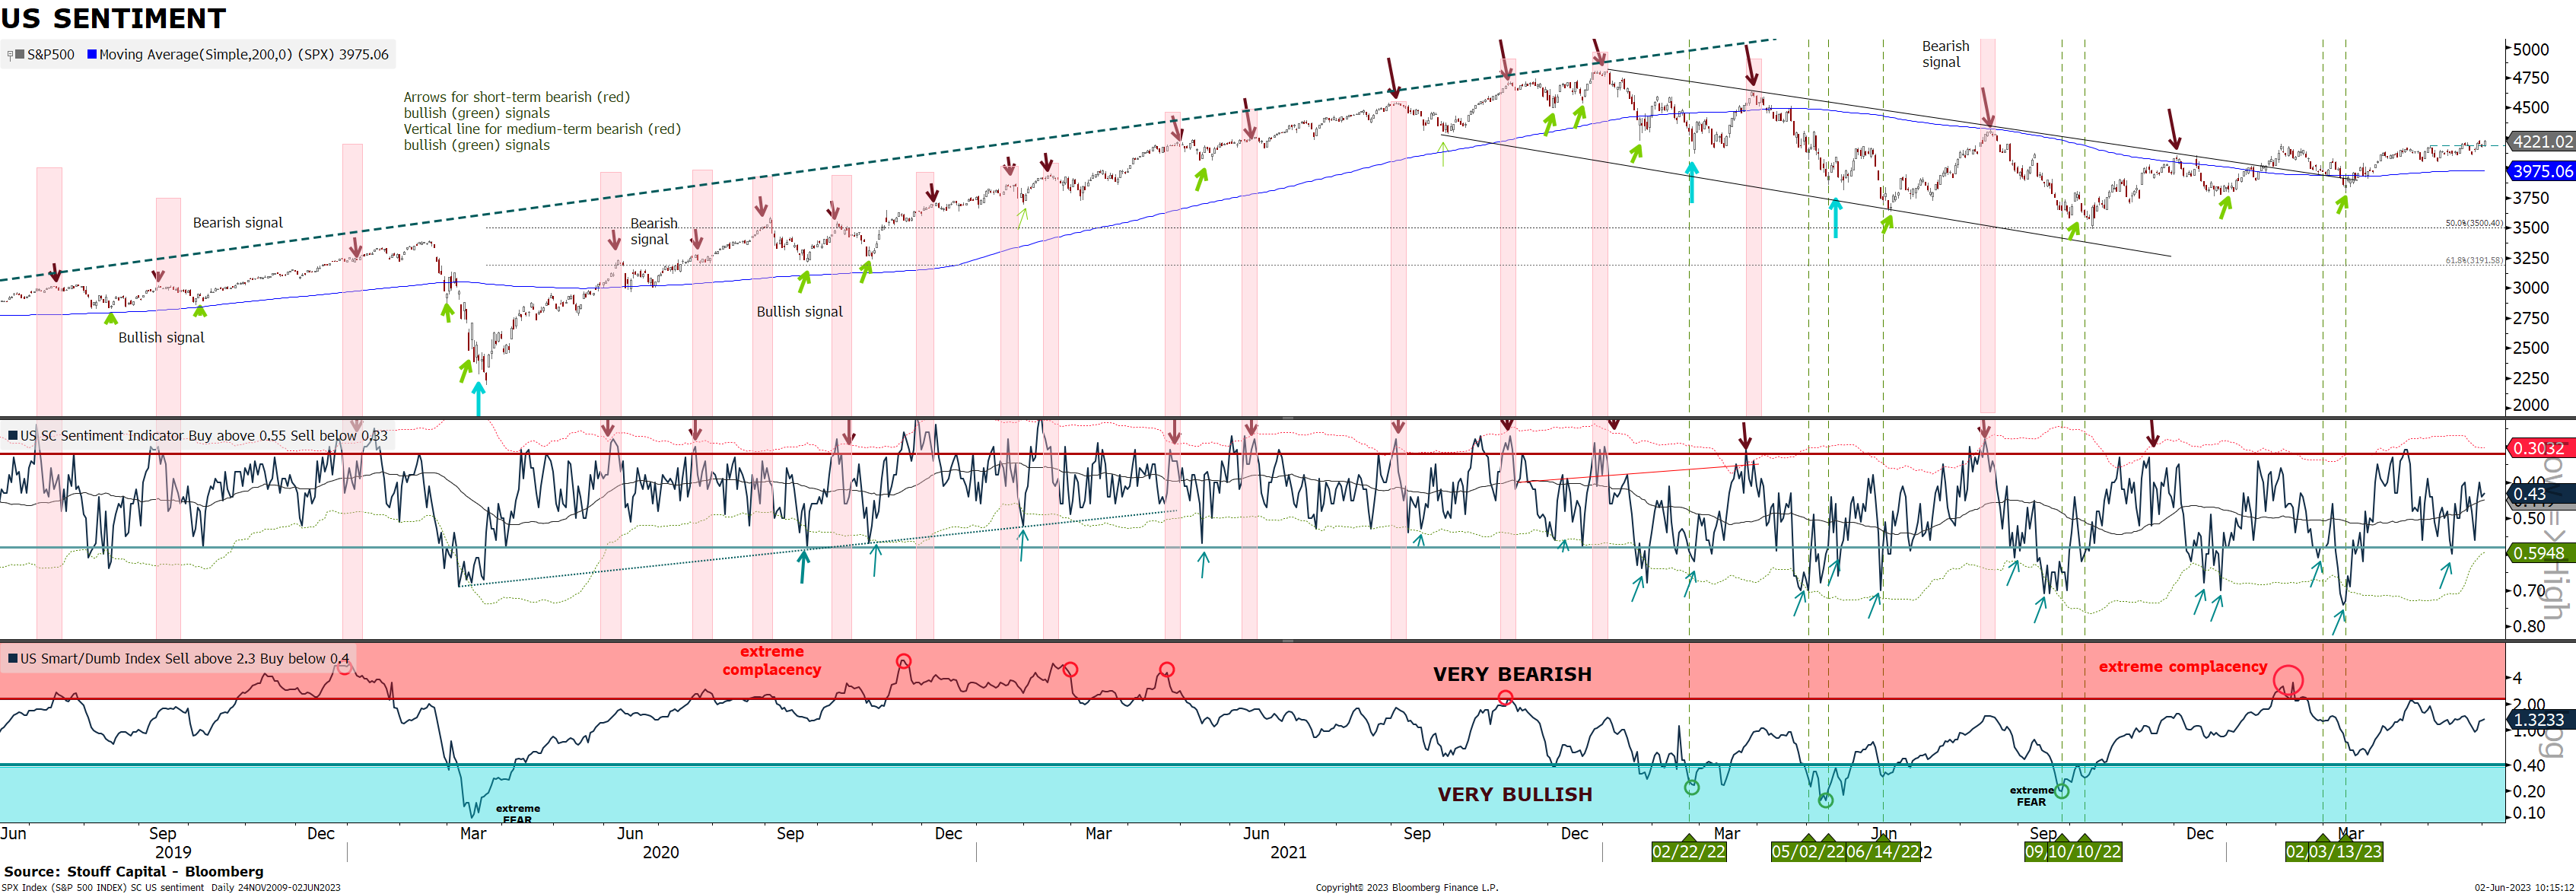
Other pillars of the Matrix are constructive, such as sentiment. Indeed, investors are skeptical of the rally, while indexes are near their 2023 highs. Our US SC Sentiment indicators on the above chart is neutral for the medium run, and even gave a short-term contrarian bullish signal mid-May. Statistically, rallies are stronger when they climb a wall of worry like now. Of course, this pessimism is seen in the weak breadth of the market. Only a handful of big Technology or European Luxury stocks have driven the capitalization-weighted S&P 500 and Stoxx600 index to decent gains this year. The equal-weight version of the index has languished and is down 8% relative to the other version since February. Good news is that similar large declines in the ratio between the two indexes preceded outsized gains for the average stock.
Chart 3: SC US SENTIMENT READINGS ARE NEUTRAL/ BULLISH – 02.06.23
One reason for the divergence between average equity and their cap-weight version is the new AI Bubble. The equity market has been powered by a relative handful of technology stocks that have soared on their potential to fundamentally change the world. With just seven tech behemoths surging a median 50% this year, investors are getting desperate for ways to keep up with those names, creating a FOMO in TMT space, linked to AI. We have recommanded riding that bubble with the purchase of Out-the-money calls on those names. This is working very well as those AI stocks (Palantir, Meta, Google, AMD, ADBE, AMZN …) have risen along with higher implied volatilities.
Another reason was the pessimism directly linked to the debt ceiling negotiations, affecting the average stock. This binary debt ceiling event forced us to recommand buying out the money near-dated (June expiry) protection, while vol was low. This gamma exposure is useful not only to be hedged against a tail risk (equities would fall more than 15% in case of non-agreement), but also in the case of a breakup. Indeed, if the S&P500 was to rise above 4220, our net exposure would increase from 20-25% to 50%. As the debt ceiling agreement seems now to be reached over the next 10 days, it may also provide a good trade. Many stocks linked to the government spending and specific companies in the tax preparation industry, student loans, defense spending, and the energy industry, should benefit all the more than they have massively underperformed going into the event.
Chart 4: Debt Ceiling Losers basket in blue – 02.06.23
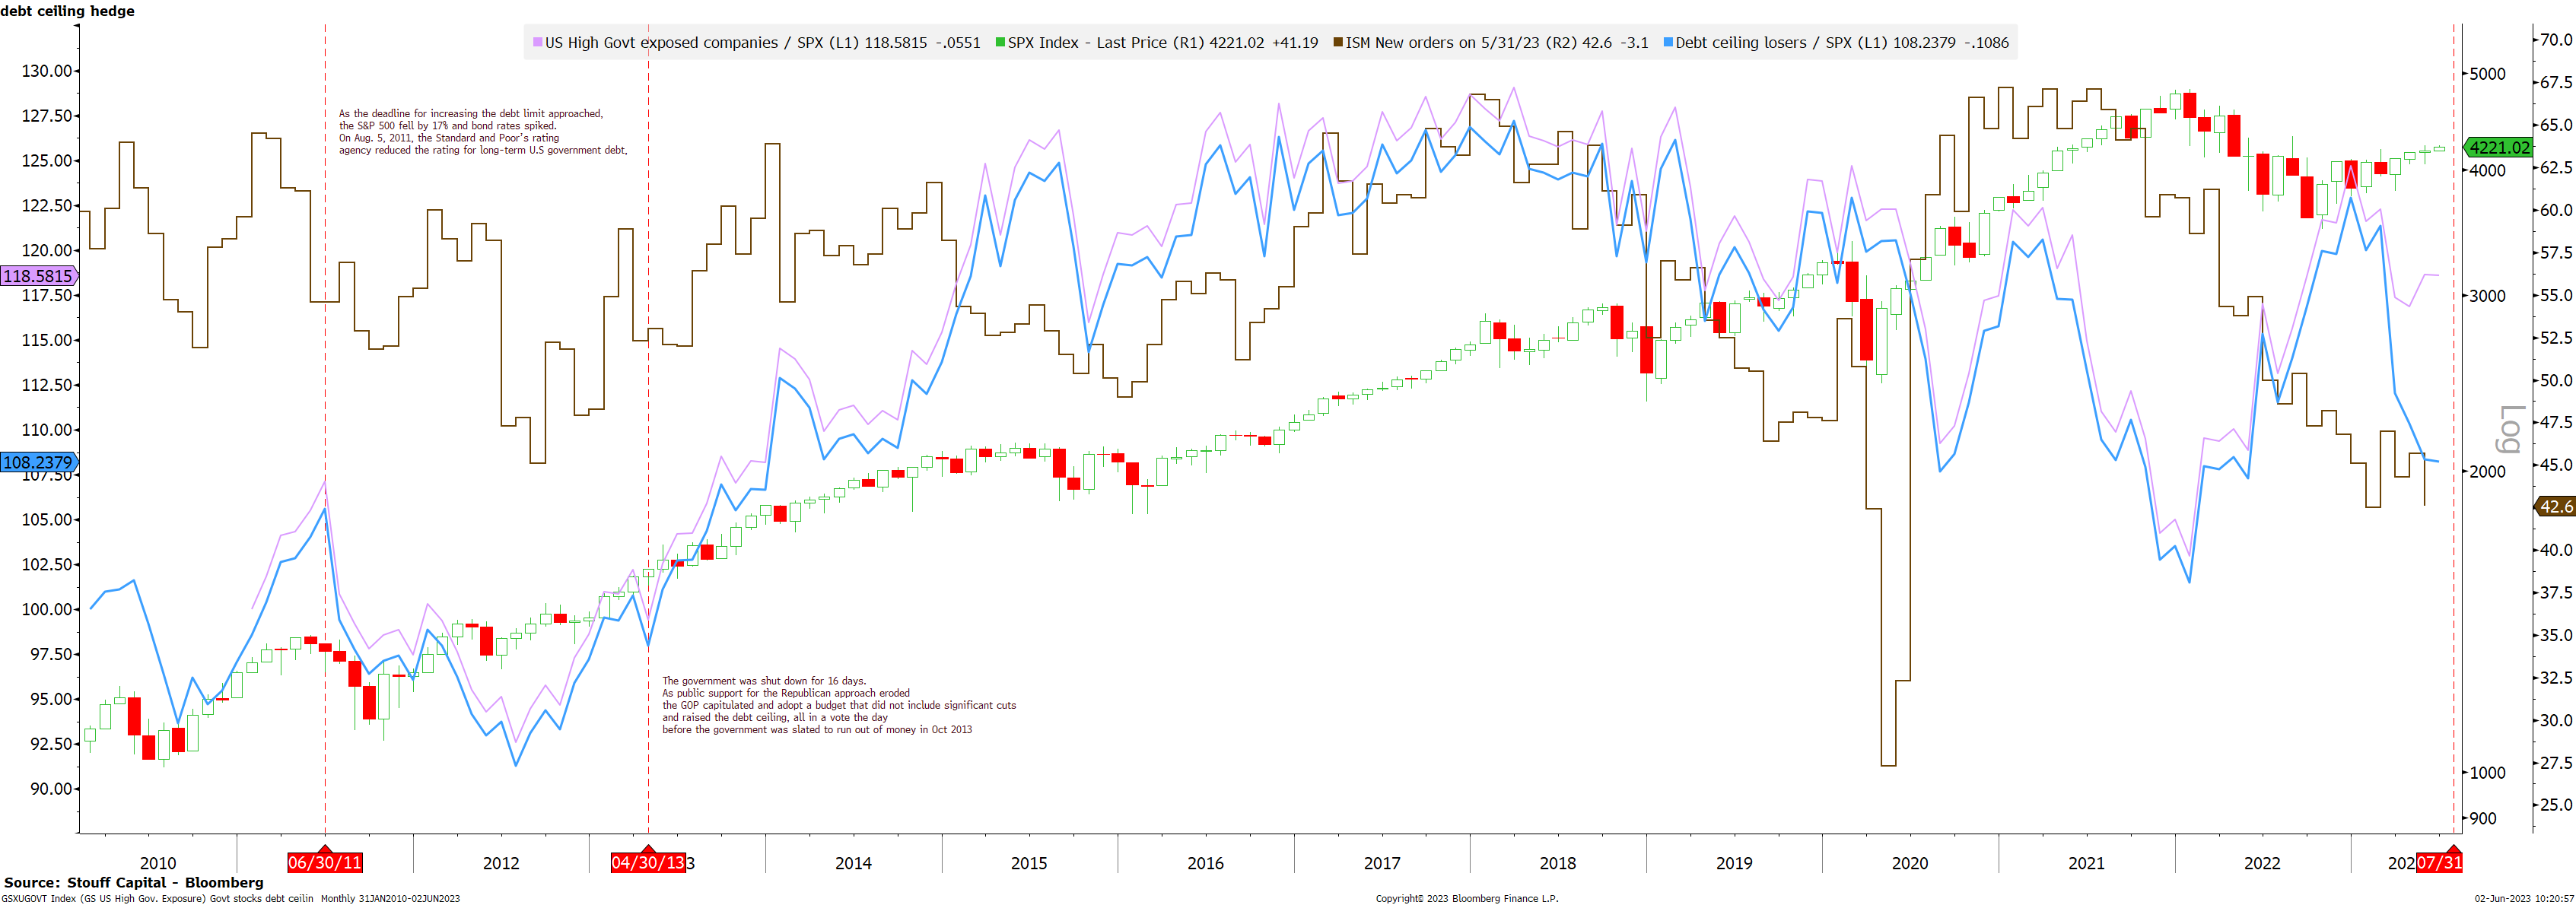
The Congress passed the legislation before the Treasury runs out of money on June 5. A lot of names should benefit, and we recommanded to buy this “Debt ceiling Losers” basket. On the chart above, we observe their significant -15% underperformance in blue versus the S&P500. There are names ranking well in our quantitative process such as Intuit (INTU), health-care companies like Elevance Health, Pfizer, Humana, Centene, UnitedHealth, Industrials like Martin Marietta.
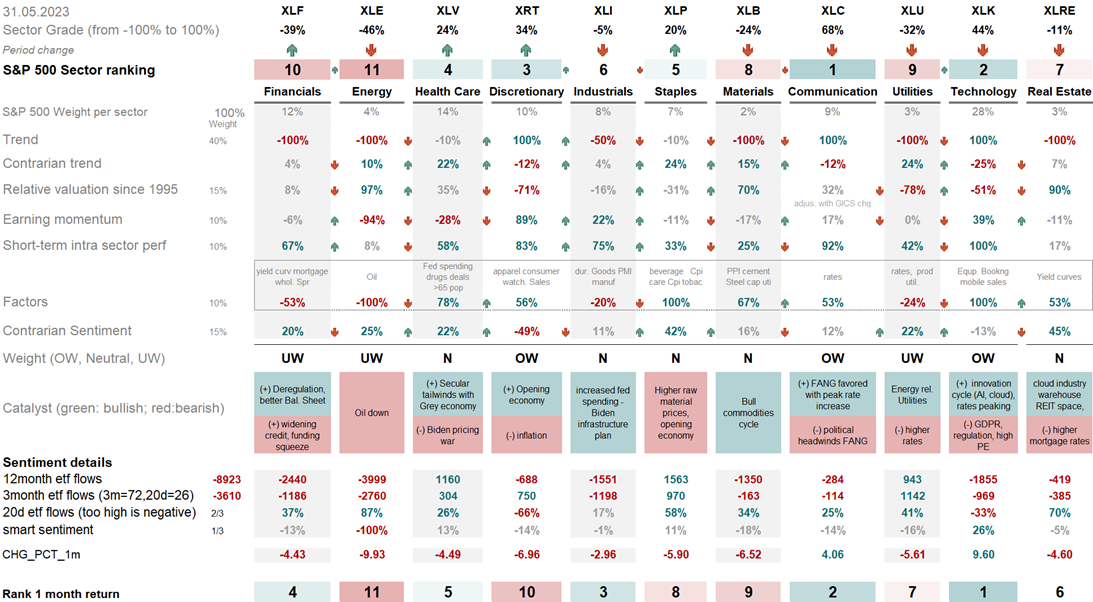
let’s now focus on the sectors favored by our quantitative process. We use a similar matrix for every region in order to rank sectors based on facts. In the USA, the Sector matrix is overweight TMT (Technology and Communications) and Discretionary, as those industries are supported by better earnings momentum. We also like healthcare, that has suffered owing to the debt ceiling negotiations. Underweight sectors are Energy, Utilities, Materials and Financials. Energy & Materials suffer from an expectation of a coming recession, Financials from the evolution of the banking crisis and Utilities from higher rates as a function reaction to a sticky inflation.
Table 2: US SECTOR MATRIX, 31.05.23
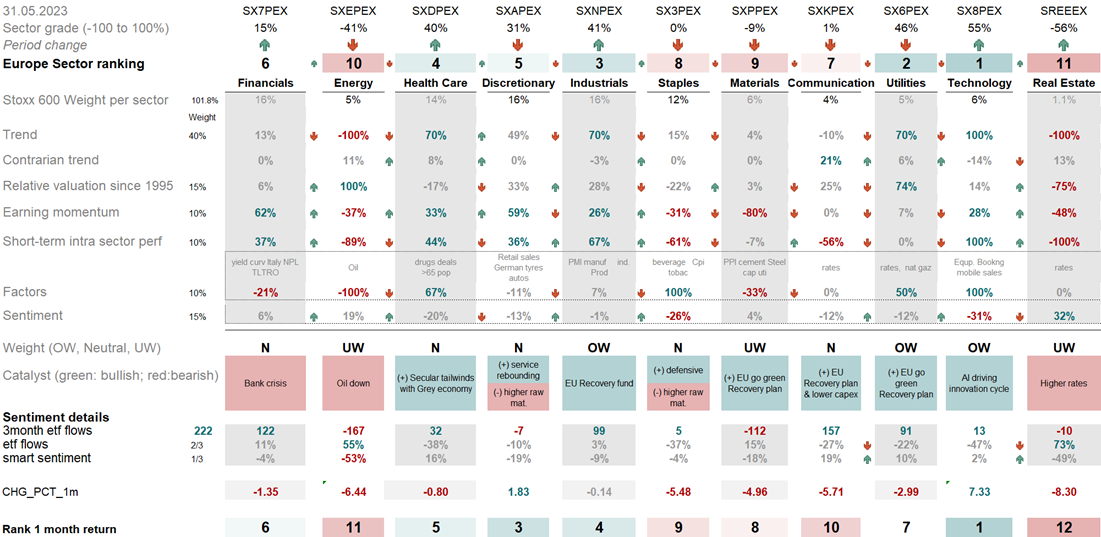
In Europe, the situation differs somehow. Financials are in a better situation and have stayed neutral. We favor Italian, Greek and Spanish banks. Utilities are OW, supported by the European fiscal Recovery plan. Industrials, Tech and Healthcare are favored in this region as shown on the below table. Energy and Materials are underweight like in the USA.
Table 3: EU SECTOR MATRIX, 31.05.23
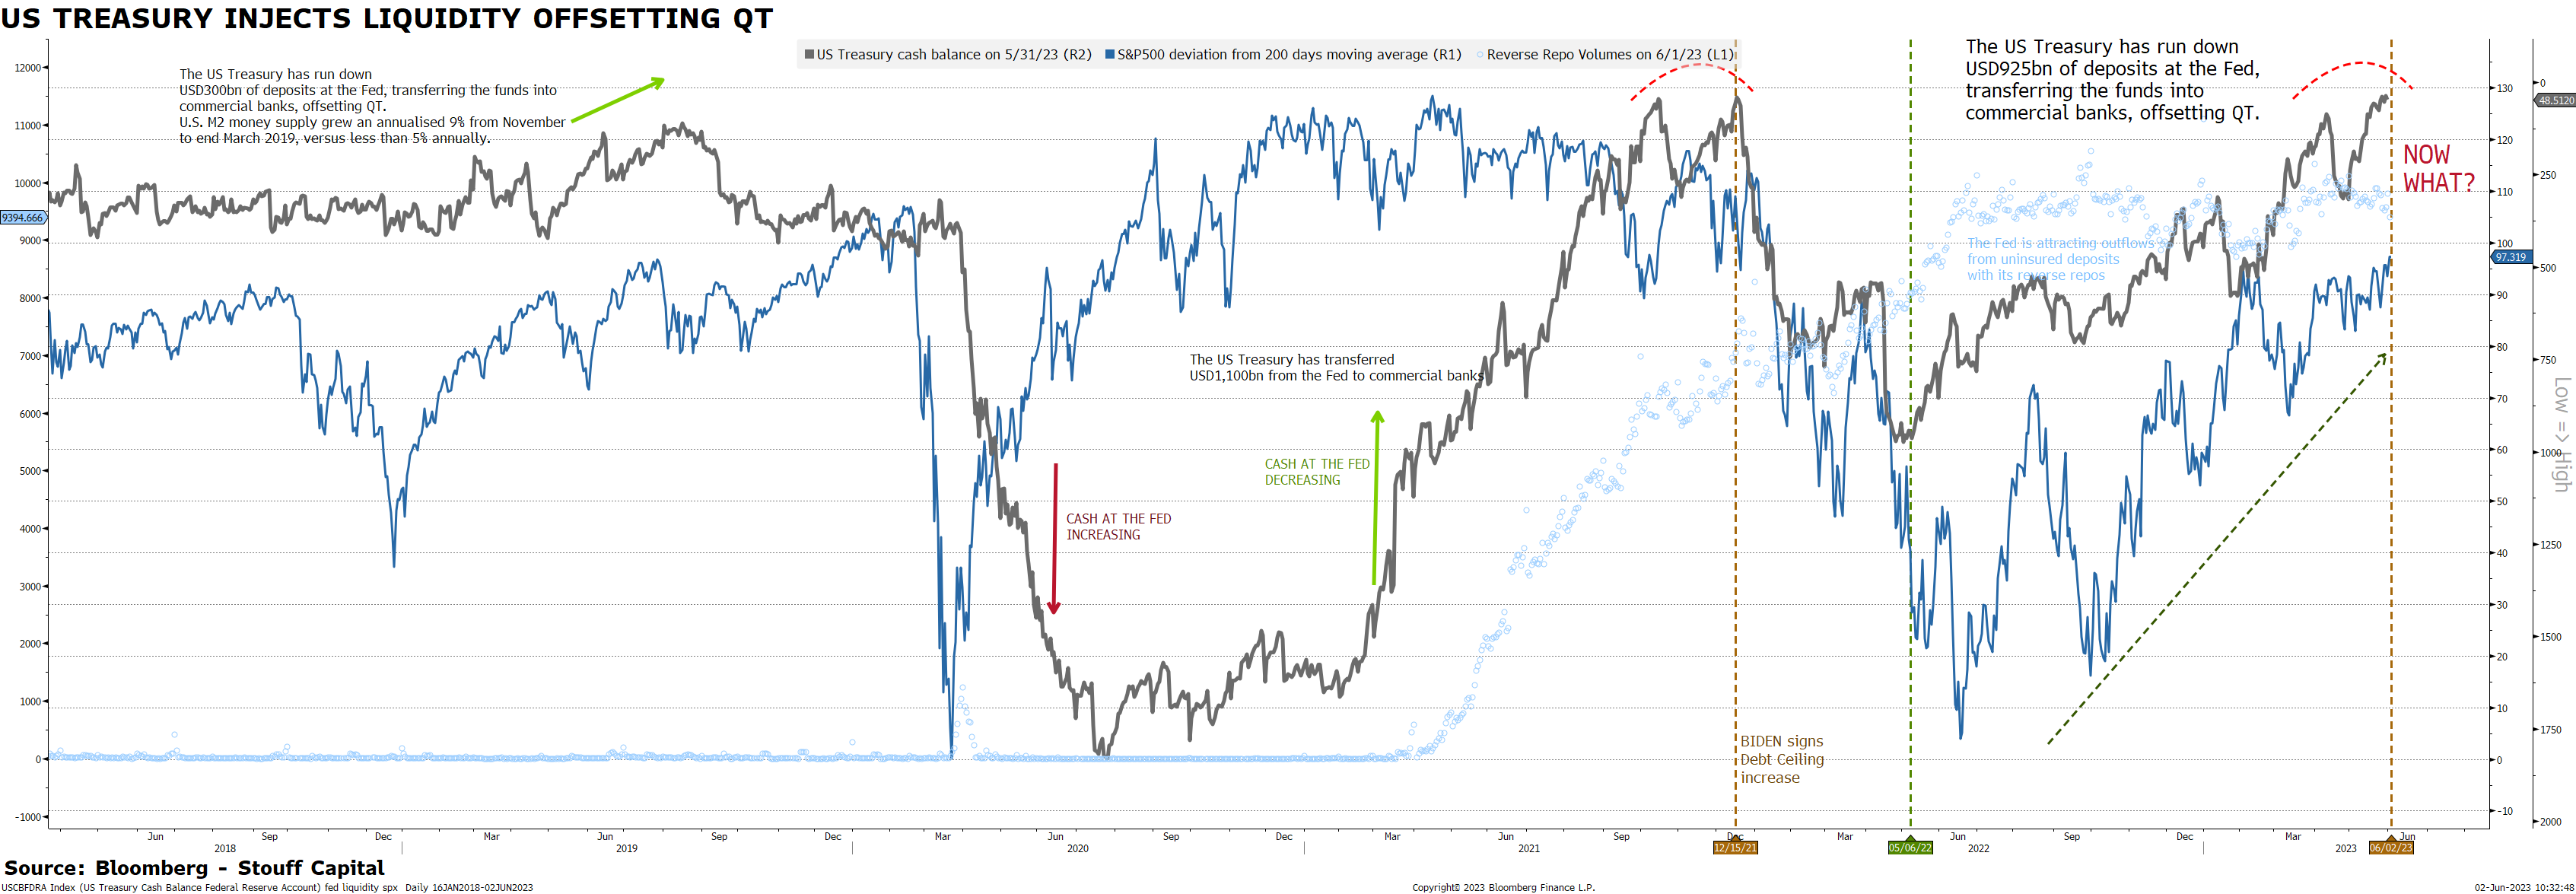
In our introduction, we mentioned that, before the debt ceiling negotiations, markets were torn between two headwinds: inflation and recession. Reaching an agreement on the debt ceiling is, no doubt, welcome news but market focus will return to those Charybdis and Scylla monsters. The question is how equities could breakup with those 2 massive headwinds. But first, there is a consensual bearish call post debt ceiling resolution. The Treasury department will need to issue a lot of debt in the coming months to replenish the Treasury’s General Account. In both the US and Europe, hundreds of billions of dollars of bank reserves would likely be drained as the US Treasury refills its checking account after the debt ceiling is raised (black line on the below chart), and in Europe a large amount of TLTROs rolls off in June, on top of ongoing QT and historically weak money supply (annex 2). Equities typically have a strong correlation to monetary liquidity, and this drain could push stocks down 7 to 10% based on historical relationship. For instance, after December 2021, the US Treasury increased its cash at the Fed, which corresponded to a correction in the S&p500. The impact in the US could be even greater this time since this reduction in the quantity of money may also come with an increase in the price of money, putting pressure on bank and investor funding costs, with potential negative implications for broader equity markets. Our take on this negative development is that it is exaggerated. It may be a headwind on the short run, after an initial pop on the debt ceiling resolution, but many points should attenuate the impact: (1) there is no proven causal link banks use reserves to buy equities, (2) the Treasury may issue T-Bills instead of Bonds having a less profound impact on long duration stocks, (3) Liquidity is one pillar of our Matrix, and QT and rate hikes have already been telegraphed and well-priced by markets for the last 18 months.
Chart 4: US TREASURY EMPTIED THE TGA TO PAY BILLS – 02.06.23
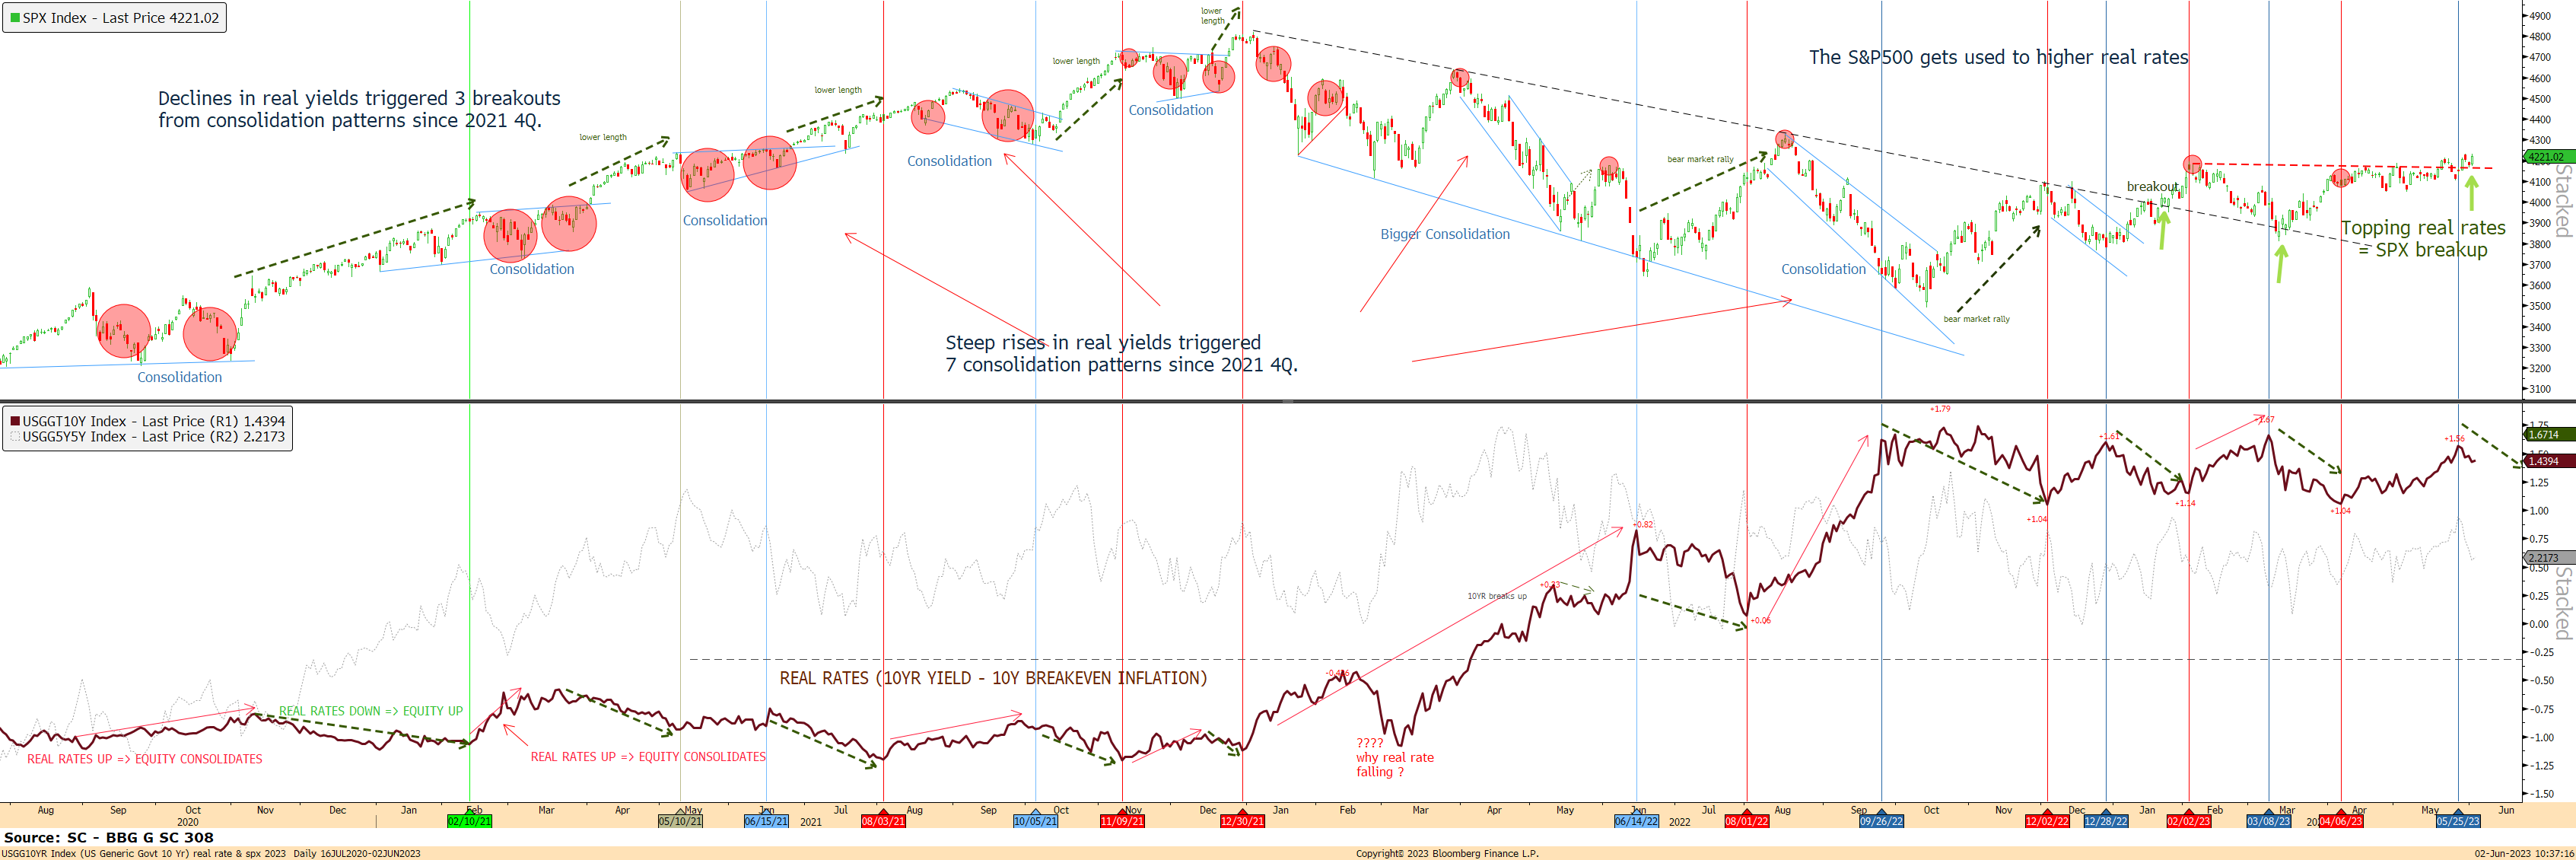
In fact, our favorite chart to navigate equities shows the correlation between real yields and stock prices. Indeed, there has been a tight link since 2017 between after-inflation Treasury yields (real yields) and the valuation of the market using forward price/earnings ratios; a higher yield on benchmark 10-year Treasury Inflation-Protected Securities has meant lower P/E ratios). The good news is that real yields may have topped with the debt ceiling resolution, permitting equities to finally breakup.
Chart 5: US real yields (in red) versus the S&P500 – 02.06.23
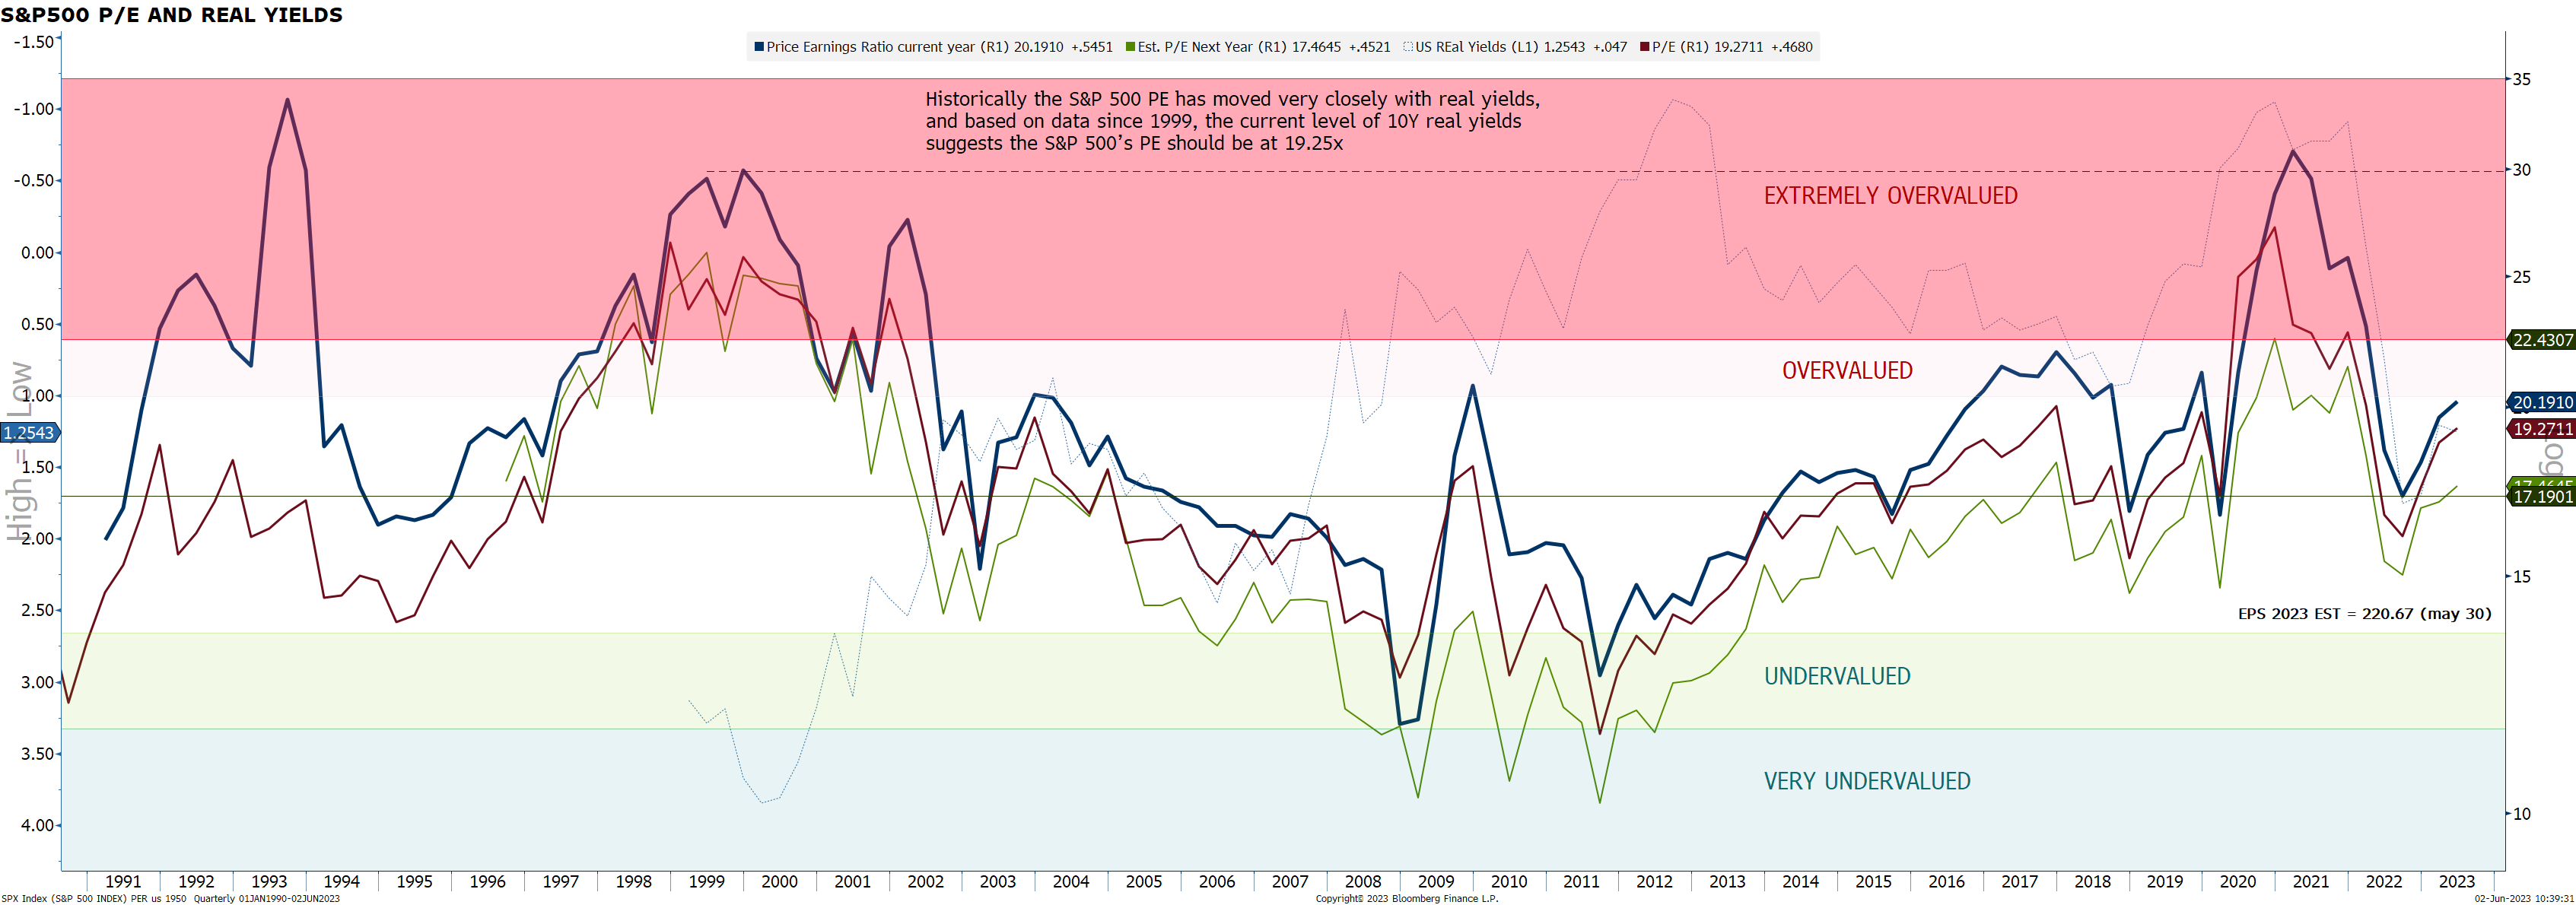
This brings us to the biggest hurdle for equities: Valuation. Here again, our quantitative output is not as severe as the consensus. Yes, 2023 P/E on the S&P500 are back to 20, as the S&P 500 forward EPS edged down to a record 220.67 from 230 high. The earnings down-cycle seems to be only just getting started based on the consensus with the coming recession. But let’s see what history tells us: The market tends to be ahead of the earnings cycle, often by several quarters. In an early-cycle bull market, we tend to see valuations expand while earnings are still contracting. In fact, 2024 EPS are expected to climb to 247, reducing the P/E to a 33 Year average at 17. Thus, for the lows to be in, this cycle could be a repeat of 2016, where the Fed pivots just in time before earnings produce a left tail.
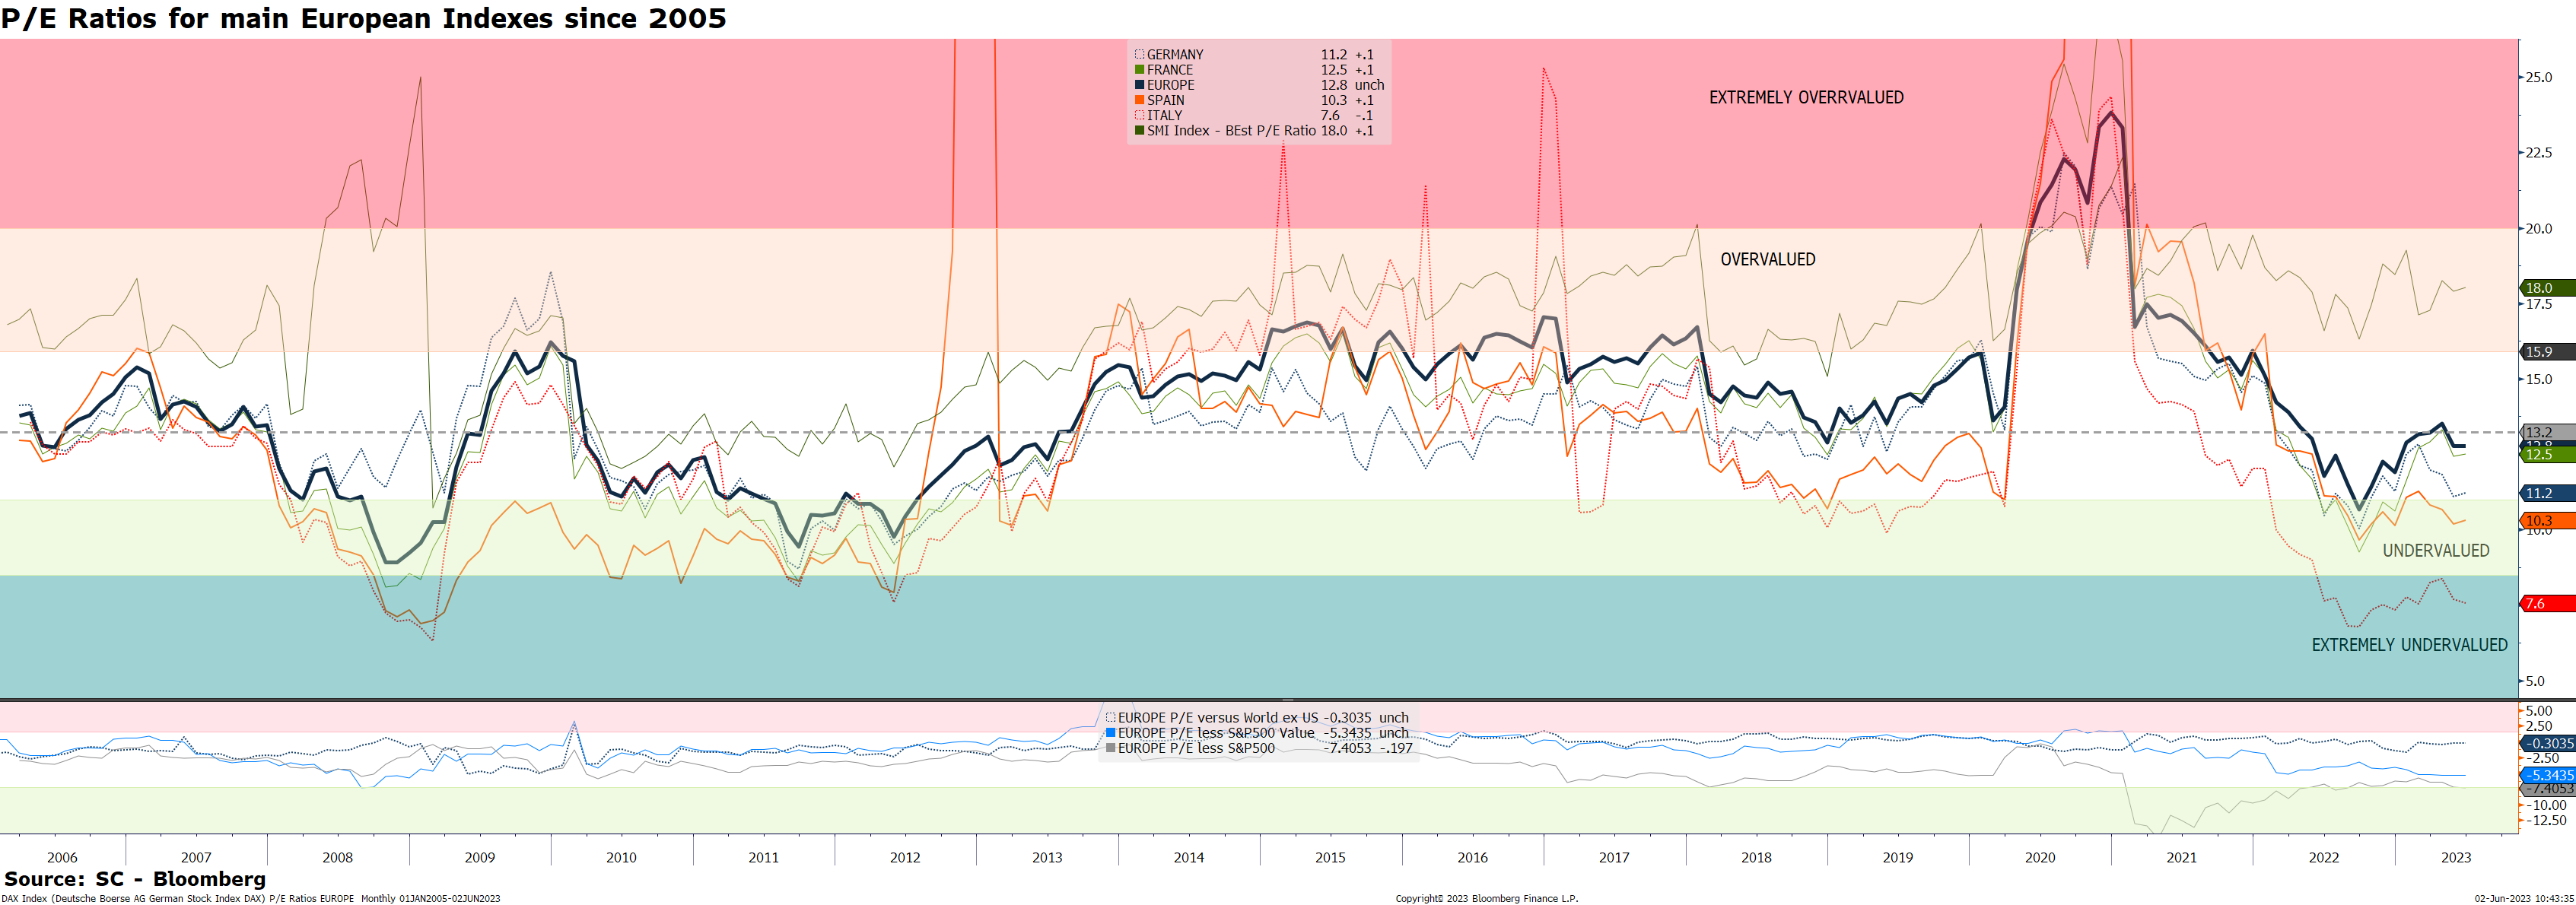
In Europe, this is another story, P/E s are low at 10.3 for Spain, 11.2 for Germany or 7.9 for Italy. Thus, adopting a non-US centric allocation resolved the expensive argument for equities.
Chart 6: GLOBAL VALUATIONS – US P/E, EUROPEAN P/E(s) – 30.05.23
Last but not least, EM and especially Chinese stocks are very cheap. You could respond: who cares? as we know that positioning in Chinese equities has been falling continuously (gross leverage is in the 26th %-tile since 2010). Chinese stocks are getting hammered again, dragging emerging markets indexes along with them. It stays a very frustrative allocation despite our regional matrix staying OW.
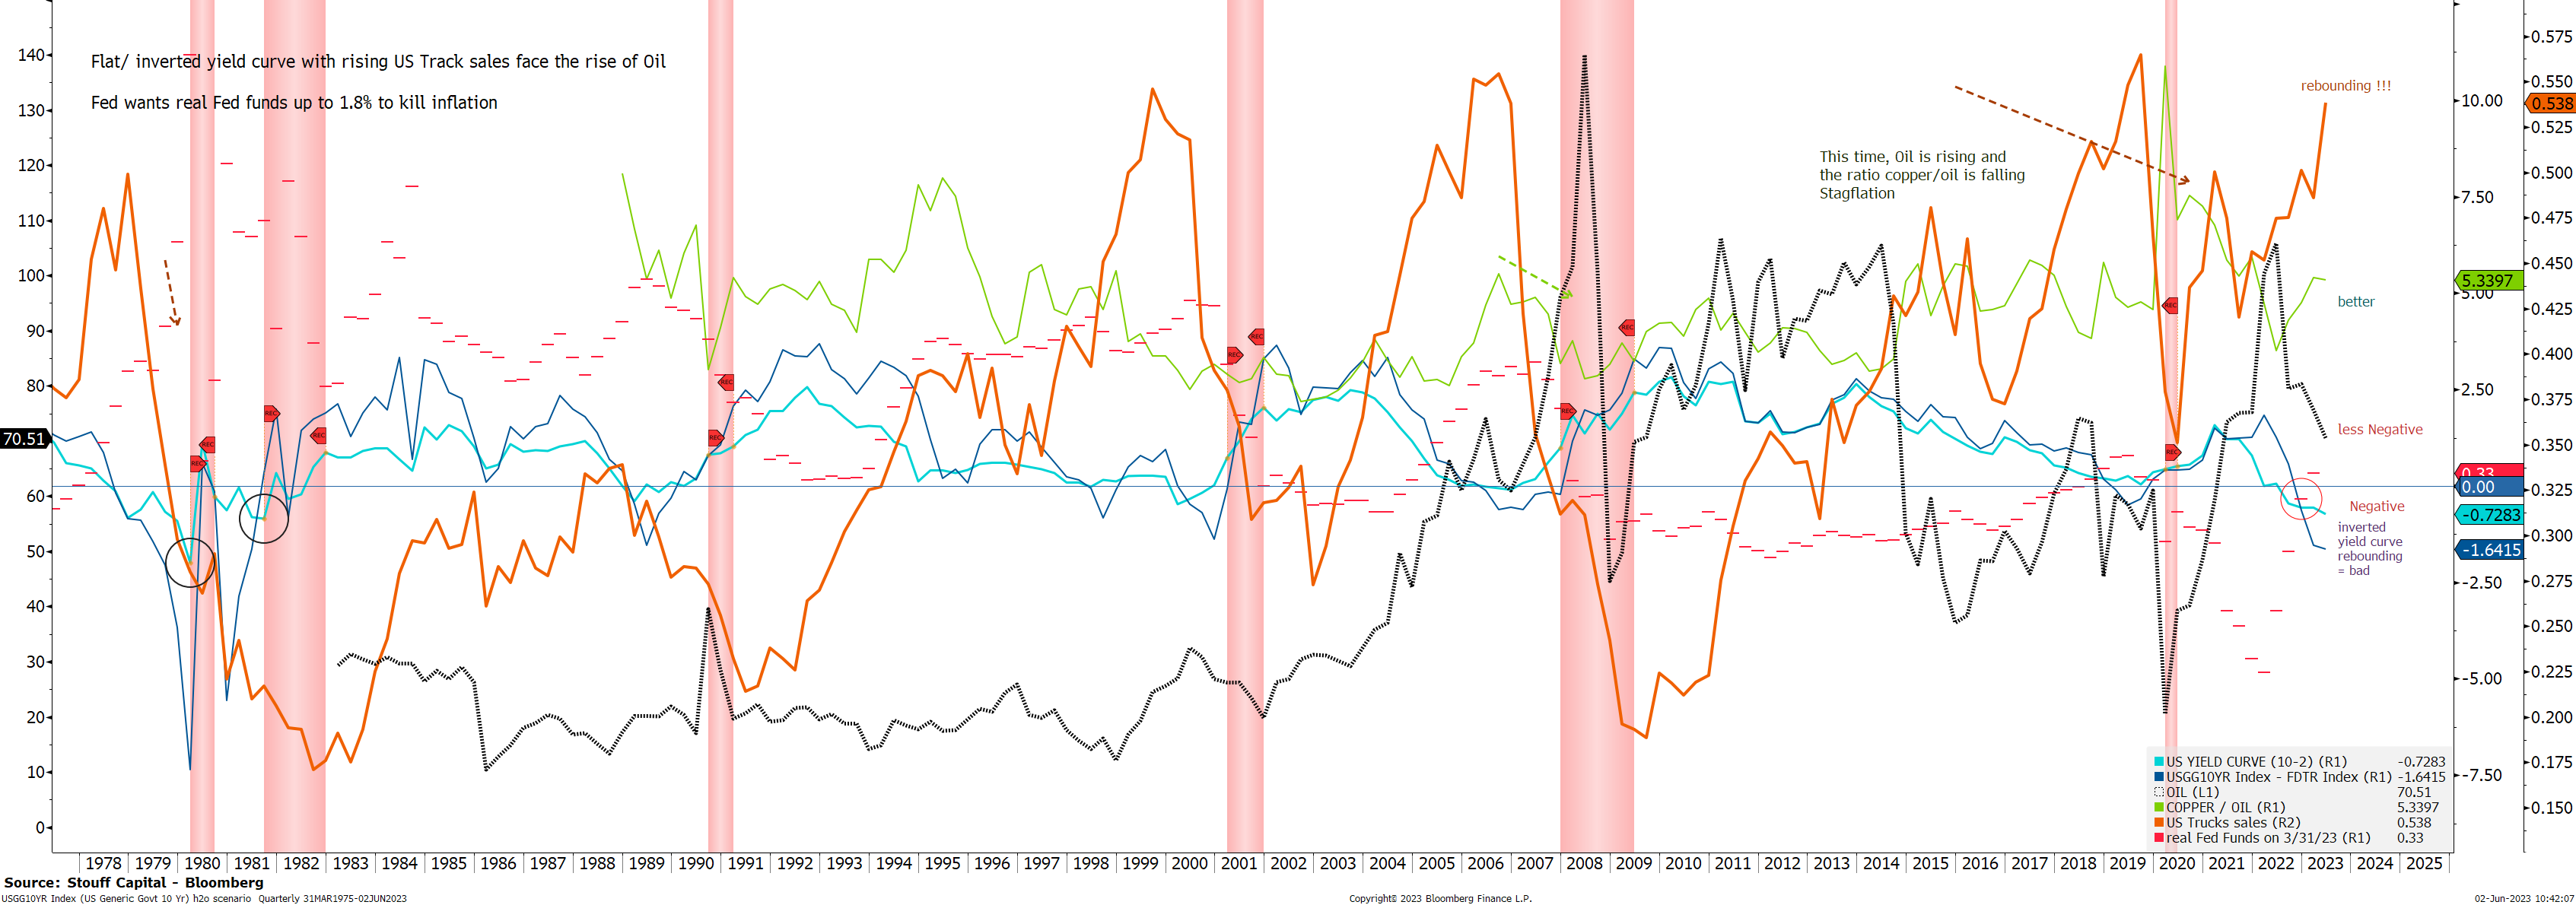
Let’s finish with a very encouraging chart. It is a simple chart to anticipate economic recession based on 3 criteria, (1) inversion of the yield curve in blue, (2) oil rising in black and the ratio of copper/ oil falling in green, and (3) heavy truck sales in orange. In fact, not all yield curves inversions have triggered a recession. But they have triggered one when oil has been rising and truck sales collapsing. What we observe on chart 7 is that heavy truck sales are rising strongly, while oil is falling hard: recession is not there yet.
Chart 7: The Recession predictor is a NO GO –02.06.23
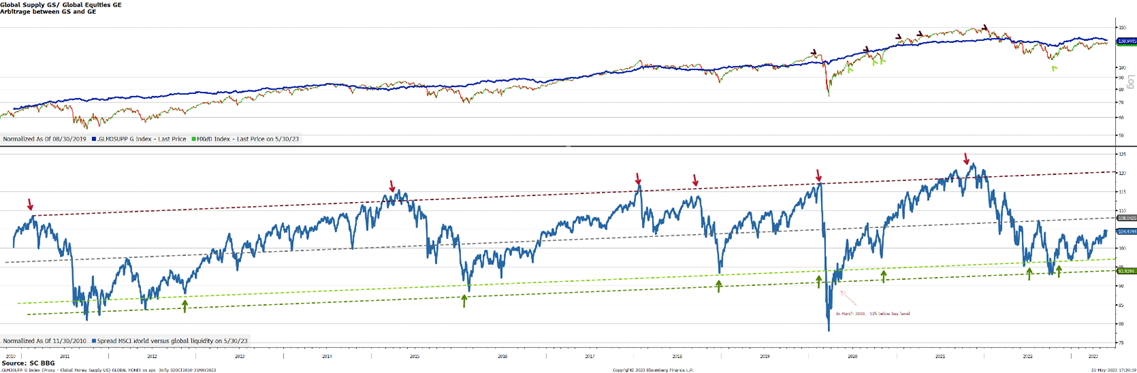
Another positive argument is our ratio between global liquidity and the MSCI World on chart 8. All in all, our quantitative process shows a breakup in the coming weeks or months could be supported by many factors: a too negative sentiment (people are under positioning and willing the market lower, and that for now, as has been the case for much of 2023, the market will not give the fans what they want), US valuation re-becoming attractive based on 2024 EPS, attractive ex US valuations, a possible already priced recession (if it even occurs) through the negative 2023 return for the average stock, a rebounding breadth favoring smaller caps (see annex 3), and all that leaded by an AI bubble.
Chart 8: The Ratio MSCI World / global liquidity is supportive – 30.05.23
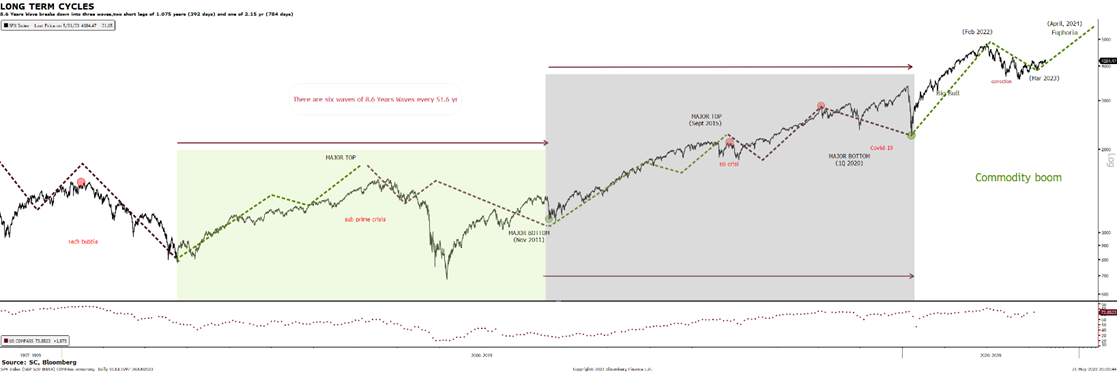
Our long-term cycle chart 9 also shows that equities should have started a new rise on March 2023, until mid-2024.
Chart 9: The “Long Term Cycle” predicts the start of a new bull market until mid 2024 – 30.05.23
This letter is not (yet) an “All In” recommendation. Indeed, we recommanded to buy a cheap short-term straddle on the S&P 500 and upside calls on Tech names to give us time about the coming outcomes (1) either a multi-month breakup, or (2) a post debt ceiling buy the rumor/ sell the fact if liquidity is reversing.