
June 2023: 2023-24 views
Talking with investors, we understand that there has rarely been such an uncertainty about what market should do. Most investors are very skeptical of the 2023 rise in equities for many reasons: high inflation, coming recession, debt ceiling, Quantitative tightening, high valuation, low breadth. At the same time, the S&P500 and MSCI World are on the edge of a major breakout.
Read moreDecember 2022: Outlook and review of 2022 theoretical trades

On the fourth year anniversary of our global equity long/short strategy we publish a trade review – summary of performance of these trades – that delivered as of Dec 30th, a +11.27% theoretical performance in 2022. This has been achieved with a net delta between -15% and +35%, thanks to a 69% win ratio.
Those who would be interested to get a pricing for these tactical ideas can write to [email protected].
Read moreNovember 2022 Caimans, Alligators and Crocodiles
In this letter, we look into the many divergences that are puzzling to us. Between the different asset classes, sectors, pairs of stocks, regions, we identify a list of spreads that we classified into 3 categories: the short-term and small opportunities which we will qualify as caiman spreads, the medium run or cyclical spreads which we will call the Alligator spreads, and the secular big ones, on which the play could last for a very long period: the Crocodile spreads.
Read moreFebruary 21st, 2022 L’inflation ou le pari de Pascal
Comme Pascal, faire le pari de l’inflation durable serait la solution d’investissement futur. Car, ne pas le faire offre un rendement risque pitoyale. Pour continuer à dégager des performances entre 6 et 10% par an dans un monde très inflationniste, nous structurons notre portefeuille afin qu’il monétise une volatilité élevée de façon structurelle, par une approche convexe.
Read moreAugust 31st, 2021 L’art de la Tragédie
En tant que concept de déjà-vu, l’art de la tragédie hante à nouveau les investisseurs avec la forte hausse de l’inflation.
Read moreMay 18th, 2021: Das Kapital
We think the upside for equities is now limited as two major risks become reality: higher interest rates or, as we named it, “The Art of Tragedy”; and higher US corporate taxes, our new thematic dumbed “Das Kapital”. The current market reversal is already confirming the double whammy. While ultra-accommodative central bank policy has helped support stocks near record highs, these levels looked precarious given implications of higher taxes against the potential spillover benefits of spending on infrastructure. We reiterate our forecast of a negative year for US equities. A possible last spike to 4,350 could be followed by an even stronger correction in the last 4 months of the year.
Read moreMarch 1st, 2021: The Art of Tragedy
From 2013 to 2014, we named the market anxiety on the Fed tapering (reversal of quantitative easing policy) the “Art of Tragedy”. As a déjà vu concept, the Art of Tragedy is haunting investors again with the steep rise of inflation breakeven and long-term rates. This has recently put pressure on risky assets as their (very) high valuations must now incorporate the end of the extreme dovish monetary conditions.
Tragedy, a western civilization’s invention, is based on human suffering that invokes in its audience (who knows that is going to end badly) an accompanying catharsis. Its rules are strict and consist in 3 unities:
(1) Unity of Location: Washington DC, where FOMC members will meet for the much expected and feared outcomes.
(2) Unity of Action: the tapering drama.
(3) Unity of Time: September 22, 2021 FOMC meeting.
December 29th, 2020: Back to the future
On our way to work this morning, we came across two editions of our letters at the back of the tram… We looked around to see who had discarded them, then saw to our surprise that they were dated 24 December 2021 and 19 October 2029! Once again, we had stumbled upon two editions of our publication… from the future!
Read moreNovember 2nd, 2020: buy the dip
The MSCI World has undergone a second 8% sell-off in October after September. The second wave of the Covid19 is a posteriori the trigger for this correction, while the uncertainty around the US election creates a lot of volatility. Technically, we find a strong risk-reward to go long ahead of the US election outcome. RSI for global equities is oversold but forming a bullish divergence – The percentage of members above their 50 days moving average is also extremely oversold (have to go back to March to get such low readings) – last but not least, the MXWD is consolidationg towards its wave IV elliott wave with a possible downside target not far at 530, which corresponds to the 200 days moving average. All these technical items favour a high risk reward bullish setup for the end of the year, with a 636 target, or a 15% return.
Read moreJuly 2020: Our long term convictions post Covid 19 through our recent webinar
After rightly being net short for trivial and technical reasons at the start of 2020, we have been wrong when the local Chinese Coronavirus crisis spread to a pandemic, as global equities underwent their worst market crash since 1987, with the MSCI World losing around 35% in just a month.
However, our costly mistake has been followed by the right conviction in a V rebound for economic and markets. Indeed, after a massive injection of liquidity by central banks associated with historical fiscal plans (EU sovereign fund, Chinese and US stimulus) global equities are now just 5% below the pre-crash level. Some equity indexes have even recouped their losses like the DAX and the S&P500, or even better have strongly risen like the Nasdaq benefiting from the confinement. After this roller coaster, what could happen in the coming weeks ? In our July webinar, we present our tactical views but start with strong long term convictions. Indeed, we think the Covid-19 has ended a cycle with the deepest but probably shortest recession since 1929. A new cycle may have started in April, with a new equity long term bull market, with exuberant traits, like in Wonderland, the dreamt world of Alice. We compare Lewis Carroll masterpiece Alice’s Adventures in Wonderland with the current financial situation, as what would have been nonsense in the past could become normal in the near future, just like in Alice’s dreams.
Read moreDecember 2019: A small Short
Positionning is giving clues for a coming small correction (small or not). According to the BofA Fund Managers’ survey, allocation to global equities jumped 10 percentage points month-on-month to a net 31% overweight which is the highest level in a year, while their cash levels — a gauge of risk aversion — are the lowest since March 2013 at 4.2%. Then, after more than 9 months, the AAII survey of individual investors shows that more than two-thirds of them are finally optimistic. This ends one of the longest streaks in 30 years. Other times that long streaks ended, stocks struggled over the medium-term.
Read moreOctober 2019: Outlook and review of a bit more than one year of trades
We publish our main top down convictions on this website every two months. Through our Research website, members also have access to the explanation of our full process through bi-weekly letters, to our quantamental and purely quantitative portfolios and also to all our real-time trade ideas. On the first year anniversary of our global equity long/short strategy we publish a trade review – summary of performance of these trades – that delivered as of Oct 31st, +10.25% performance in 2019 and 11.31% since 1 May 2018. This has been achieved with a low net delta (between -10% and +25%), an annualized volatility below 5% and a gross exposure below 200%, thanks to a 70% win ratio. Those who would be interested to get a pricing for these tactical ideas can write to [email protected].
Read moreJuly 2019: The Magnificent Seven or the rational exuberance
We believe we are at a very important crossroads right now. We have been articulating our trades since the end of 2017 in the context of a new market regime with higher volatility driven by political surprises (to be polite) and QT (quantitative tightening). After a massive bull run from April 2012 to January 2018, we suggested that global equities was about to enter a multi-year wide and volatile range trading. The S&P500 is now at the upper end of that 2350-3000 range once again, just like in January and September last year.
Read moreJune 2019: Oversold short-term, a bounce is coming…
In the very, very near-term, it may not be wise to aggressively press shorts given the potential for some of the trade headwinds to reverse and a lot of the most cyclical groups have already enormously underperformed.
Read moreMay 27th, 2019: Is anything really right or wrong ?

Until mid April, investors have been convinced that a market correction was coming. Then, at the exact time the market topped, they have become finally bullish and are now convinced that buying the dip is the right strategy. Is it really right ? We have been looking back at how political sentiment (the fear of a war in North-Korea, the fear of Marine Le Pen winning the French presidential elections, the fear of President Trump embarking on a trade war…) has been driving investor positioning over the past 3 years. In our view, the consensus position has consistently been proven wrong, and it is more the contrarian approach that has been right up to now.
In our view, the right approach is to focus on selling the rallys (or even the breakdowns), rather than to fixate on calling the rebound. Markets face a weaker economic environment, with surprisingly little inflation, lower earnings growth and the disappearance of the ‘wall of worry’ that supported it year to date explosive rise. Our regional matrix is still constructive on equities on the medium run, but its short term view (one month) is definitely bearish. We are now in the weakest period of the year in terms of seasonality, and a number of political headwinds have re-appeared – Trade wars, Trump impeachment, Middle-east/NorthKorea, the European elections and forever the Brexit).
So we have seen markets rise to the end of April and corrects 4% during the famous « sell in may » period (which most strategists deny would materialize). Will this be followed by another 5% down instead of a steep rise to the year end?
May 8th, 2019: “they broke the deal” and the rally – don’t buy the dips…
The U.S. raised punitive tariffs to 25%, from 10%, for $200 billion in goods leaving China on Friday and thereafter. President Trump also ordered staff to begin the paperwork to impose levies on the more than $300 billion worth of everything else China sells to the U.S. The curve of VIX futures has moved into the unusual backwardation pattern, which triggers all the more hedges and shorts from Quants than the short exposure in VIX futures from speculators was at one of its highest levels ever. Our SC sentiment indicators had flashed red short term signals at the start of May. Then, our regional matrix is now bearish for the short term on US & European equities and very bearish on EM equities. Indeed, the top-down of our quantamental approach relies on this Equity Regional matrix. This matrix, shown in the below chart, is made up of six indicators that draw data from leading regional indices, indicators and surveys. It informs our net exposure globally and by region, on a medium term and short term outlook. Our short term (one month) outlook has diverged from our 3 month: this is always a complicated risk management decision. In December it was the inverse situation when our one month outlook turned north while our matrix was very bearish on the medium term. What drives the balance in our exposure, when these divergences happen, comes from our contrarian models: they were ultra-bullish in December and we went long, they were ultra-BEARISH two weeks ago and thus we should be short or at least extremely cautious.
Read moreMarch 2019: The return to normal regime
If you went away on a deserted Island at the end of October 2018 and just came back, the widespread negativity has largely dissipated, and the overall risk environment appears to be more balanced. Sentiment has turned more positive, VIX back to the lows seen last summer (now at 13.6%!), signalling a move towards complacency. But, if you look at the 4 months moves, it has been a wild ride, with one of the worst fourth quarters on record followed by one of the best starts to a new year.
Reading the news, you discover that the Fed made a dramatic pivot in its communication (even talking about an averaging inflation targeting), and investors have finally considered that geopolitical headwinds are nothing new, and while data has generally been mixed, media and strategists tell us that opportunities are coming back for investors to focus on company fundamentals and idiosyncratic stories again. The popular explanation going around is that the fourth quarter sell-off was just a technical event, the result of an unnecessarily aggressive Fed and trade tensions between US and China. With both of those problems now nearly fixed, markets can go back to where we were before these were concerns. As such, new highs for equity indices and tighter spreads for credit can’t be far away.
Read moreFebruary 2019: Charybdis, Scylla and Circé
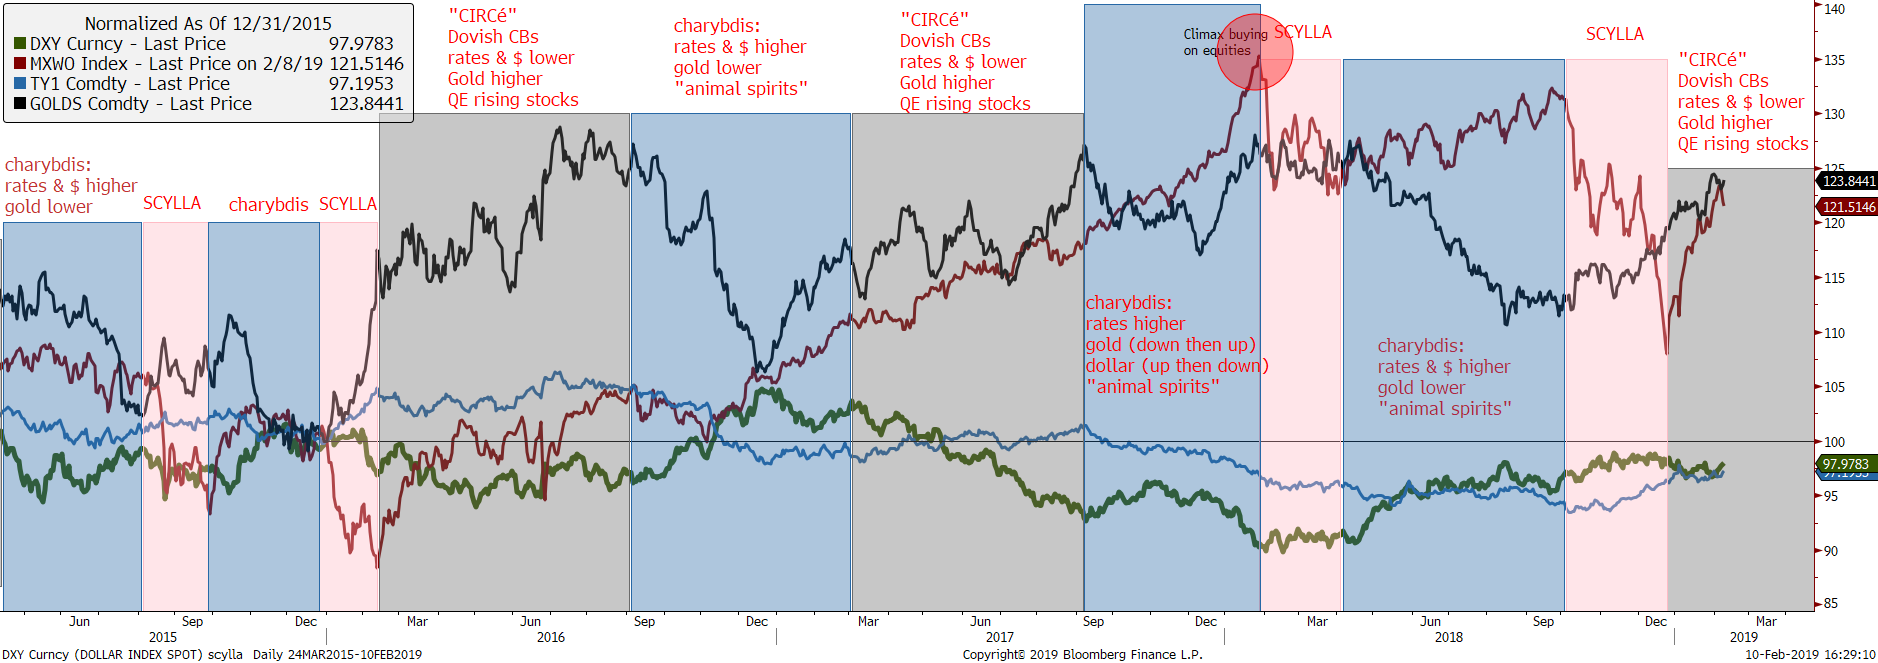
Since 2015, we have compared the market behaviour with Homer’s Odyssey, at the specific time when Ulysses gets rid of Circé grips but in his escape faces two equally dangerous monsters: Scylla and Charybdis. For us, Circé which drugs Ulysses and transforms his soldiers into pigs is comparable to our ultra-dovish central banks injecting its own QE drug; then, when markets try to navigate more freely without the drug QE, they must face the first monster “Charybdis”, characterized by higher rates, a higher dollar and volatility though rising equities. For the last years, it has ultimately ended with Scylla, or an equity sell-off, with gold & bonds rising. Then, the wheel turns again and Circé recuperates the wounded navigators and feeds them with her new doses of QE drugs. We are back in Circé world: Equities have strongly rebounded thanks to the new dovishness of central banks and bonds are skyrocketing again. An earnings season initially thought to invoke a long-volatility bias is turning out to be a short-volatility opportunity, thanks to Circé. So what does this paradigm tell us now: can we get more Circé drugs as bonds seem to forecast (and we know rates are often more right than equities), or should the drug transition be short this time and trigger Charybda or worse Scylla?
After the worst December in a century, January’s tape has been enjoying a FOMO (fear of missing out)-induced chase-related bid. A combination of better-than-feared earnings season, light positioning, a dramatic Fed pivot, and a (likely) further cooling of US- China trade tensions created powerful tailwinds for equities and bonds. This rally is reminiscent of the 2010-2017 era with bonds and equities correlated and rising, thanks to positive sentiment driven by QEs.
Read moreDecember 2018: The end of the year (and may be the first three weeks of January) rally is coming
From a fundamental point of view, we should have expected a gentle end of the year rally as the headwinds of the market had been addressed and positioning was at its 5-year low. Indeed, Powell had given up on its hawkish communication. The truce in trade wars should have gotten rid of the major overhang for the markets. Last but not least, OPEC delivered a better than expected production cut which should have stabilized oil market.
But this proved to be a false signal as a Fed misled communication triggered extreme selling.
After the sell-off whose climax was on December 24th and 26th, we have more obvious clues that a more sustained rebound is in the cards.
Read moreOctober 2018: “Buy the dips” replaced by “sell the rally” strategy
We believe that 10 years of QE-driven low- volatility markets created a goldilocks environment for investors as bonds and all risky assets had risen in tandem. Yet we think we saw an inflexion point at the beginning of 2018, and the official switch from QE to Quantitative Tightening (QT) was in October. Indeed, this is the first month when the cumulative purchases and sales of the three main central banks turn negative.
Markets are between Scylla and Charybdis: a possible GDP & Earnings growth deceleration in 2019, and the Quantitative Tightening, or shrinking liquidity from the Fed’s ongoing balance sheet reduction and the ECB’s tapering. In this uncertain environment, the willingness of the Fed to continue its tightening puts US equities in overvalued territory compared to bonds. It adds a new headwind to the cohort of other issues like trade wars, coming margin compression, US midterm elections, hard Brexit, Italexit or Iran sanctions. We believe the environment is shifting from one where dips should be bought to one where rallies should be sold. In the medium run, as long as the Fed does not pause its tightening and a US/ China trade deal is not signed, we believe there may be more pain for the stock market to come.
Read more