
We publish our main top down convictions on this website twice a year. Through our Research website, members have also access to the explanation of our full process and its implementation through real-time alerts. On the fourth year anniversary of our global equity long/short strategy, here is the 2022 trades review – summary of performance of these trades, that delivered as of Dec 30th, +11.27% performance in 2022 versus -19.8% for the MSCI World. This has been achieved with net delta between -15% and +35%, and a gross exposure below 200%, thanks to a 69% win ratio. Those who would be interested to get a pricing for these tactical ideas can write to [email protected].
Our trades can be classified in 3 kinds:
- Allocation trades are chosen out of our various quantitative portfolios (low vol/high earning growth, U2 [unloved & undervalued], IPO) and quantamental regional portfolios (SC US long & short list, SC European Long & Short stock list, SC Asia & Japan long & short portfolios, portfolio linked to specific events such as US elections with the low tax and high tax baskets, or crypto liquid equities). The difference between the quantitative and quantamental portfolios is that pure quantitative lists are systematically constructed only by algos and rebalanced at least once a month, while quantamental are constanly updated based on the mix of algos and fundamental convictions
- Tactical trades are sent when our quantamental process identifies local or major inflexion points in the ongoing trend.
- Last but not least, we launch single stocks high conviction trades based on a mix of quantamental scoring (6 factors model weighted by the current market regime) and a list of technical signals which should improve the odds of success.
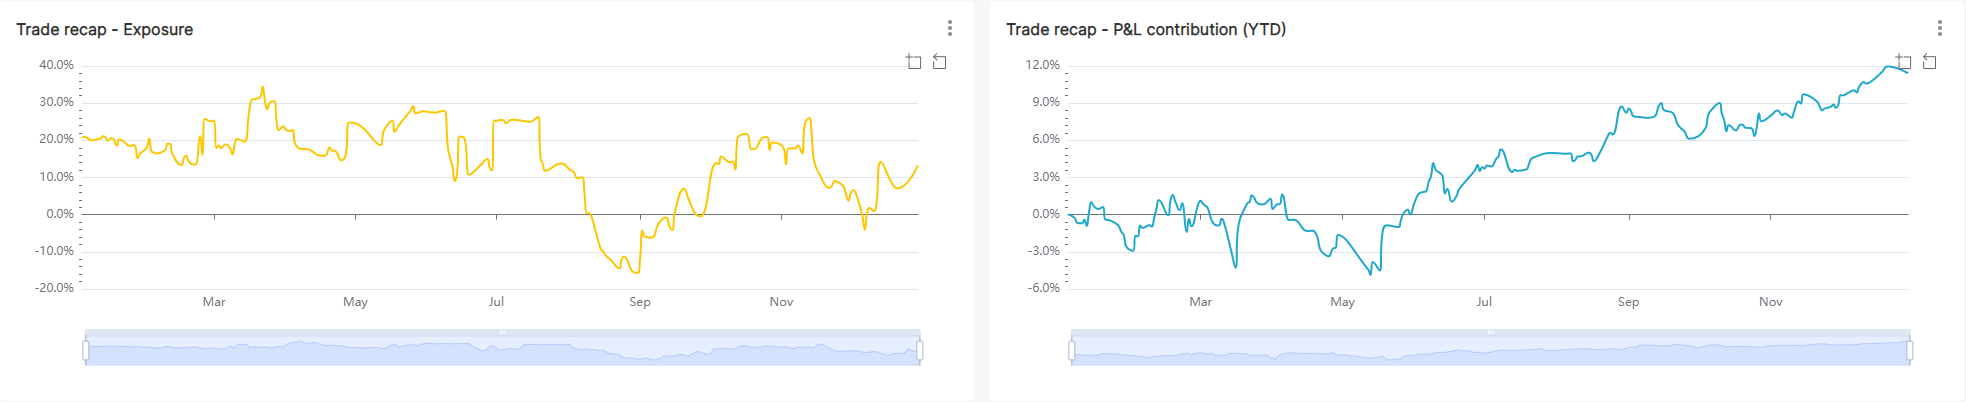
The below left hand chart shows the evolution of the net exposure in yellow, resulting from our real-time alerts sent by mail to our subscribers. The right hand chart in blue shows the evolution of the Profit and Loss resulting from those theoretical trades (no commissions, financing, transaction costs neither slippage are considered). The net exposure started 2022 between +10 and +25% of the NAV. After the March and summer’s rebounds, we initiated a lot of hedges as our allocation tool, the Regional Matrix, became cautious owing to over-confident sentiment. This enabled the NAV to rebound from a -5% to +6% in October. Indeed, the strategy became maximum net short from Mid-August to the end of September, when equities fell from the top of their summer range. Then, the net exposure switched to a positive +20~25% with the close of many shorts as our Regional Matrix triggered a CPD contrarian bullish signal when the S&P500 was around its Octobre low. The NAV ended 2022 up 11.2%, versus +14.7% in 2021.
The strong 2022 returns is explained by the bearish net exposure in 3Q and bullish tilt in 4Q, but also the alpha generated by our allocation trades and high conviction single stock ideas. Suscribers receive in real-time the various kinds of trades: Shorts are coloured in red, longs in green, the close of longs in grey. One can observe that same coloured trades are clustered around specific periods. Part of the good performance comes from the fact that red are mostly present in the local tops while Green and grey in the local bottoms.
Below is the chart showing trades sent in 2022:

While past performance does not guarantee future returns, we justify this efficient timing by the predictability power of our Contrarian Sentiment models (see chart below) in this market environment. Indeed, while our process is definitely based on momentum [in price but also fundamentals mainly through earnings momentum], our quantamental contrarian approach helps us master inflexion points.

Allocation trades – quantamental portfolios
Our Quantamental portfolios have also generated some alphas. 2022 was a year of high correlation, driven by moves between sectors / factors / themes as opposed to moves between single-names. Thus, our alpha was lower than the previous years. To outperform in 2022 required to overweigh the factor Value and taken outsize positions in the energy sector. Once we became convinced of “inflation for longer”, we also doubled down on bearish wagers against tech, pandemic high-flyers including online retailers and shares that had surged either on Fed largesse or false hopes for a durable sales boom. For other traditional high-beta sectors that did well like Brazilian equities or financials, there was often a strong valuation support.
We show the relative performance of our European and US portfolios in the chart below. The US Quantamental longs outperformed the S&P 500 by 3.9%. Our European Quantamental longs have beaten the Stoxx 600 by +2.18%. One should notice that those long quantamental portfolios underperformed in the first quadrimester, and have constantly improved their alpha since then, as we incorporated the « inflation for longer » theme in the selection of single stocks. Our short portfolios did not meet expectations in 2022, with a -1.9% alpha for the US and -1.8% in Europe.
Please see charts for quantitative and quantamental portfolios performance below:

Single stock conviction trades
Last but not least, we articulate single stock trades when we identify high risk rewards technical signals on our lists of best and worst quantamental names. Below are two examples:
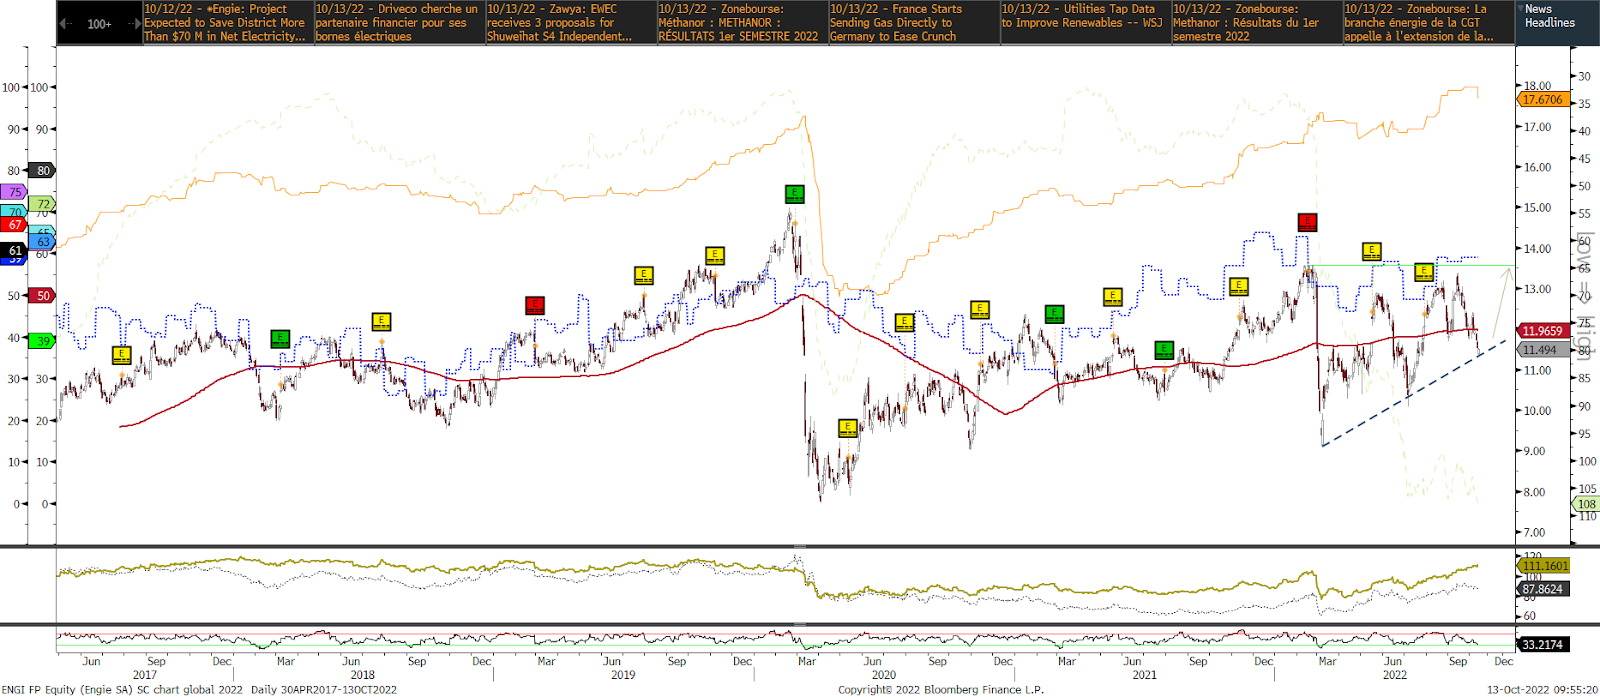
On Octobre 13th, we purchased ENGIE as a technical signal was supported by a mix of strong quantitative grades. We sent an alert saying: »Our quantitative outputs rank the mix of factors – Value grade, high dividend yield, highest share buyback – as the current best factors performers in Europe. We name it Defensive Values. Engie (ENGI FP) is part of this list, with a +7.37% dividend yield, a 63 Value grade, and has also a strong earnings momentum grade. It also has a good smart sentiment grade, telling that the best analysts recommend the name.
Technically, the stock is falling on its rising trend line, with an oversold RSI. We buy it for a first target at 13.5 ». Our target was reached in the coming weeks and was the top going forward:
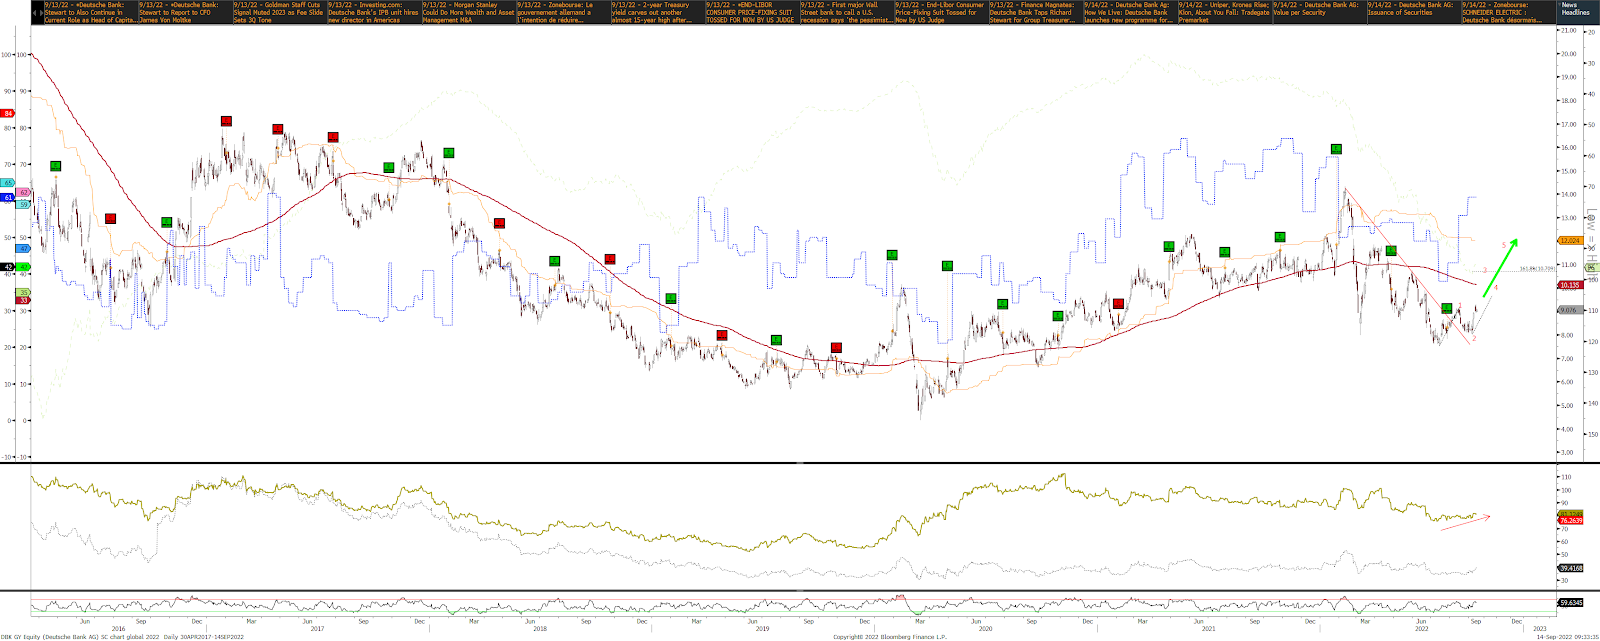
One of our big 2022 call was going long European Banks. On September 14th, we purchased Deutsche Bank with the alert saying: » … never thought about being long Deutsche Bank, as we have been systematically short for a decade. But when facts change (our factors ranking), we must listen. European Financials have been upgraded to OW by our Sector Matrix. Fundamentally, the ECB tightening process associated with better balance sheets for banks in Europe than in 2011 justify looking at them more positively. DBK factors have improved so much with our earnings momentum grade rising to 61, Volume flow supporting at 84. We buy DBK GY for a first 10.7 target then 12, and add to our long European quantamental long list. » The stock price is currently 11.8, and are still long.
Outlook 2023
Our quantitative process through our Regional Matrix (see below table) is bullish only for the short term but cautious for a three months outlook. We expect the Fed to keep increasing rates before markets realize that macroeconomic data and earnings finally collapse. We observe a confirmation of this break-down with the outperformance of defensives like Utilities in US or Staples in Europe. We also anticipate a rebound of stocks with a strong ‘Value Factor’ like the European banks and Commodity related equities.
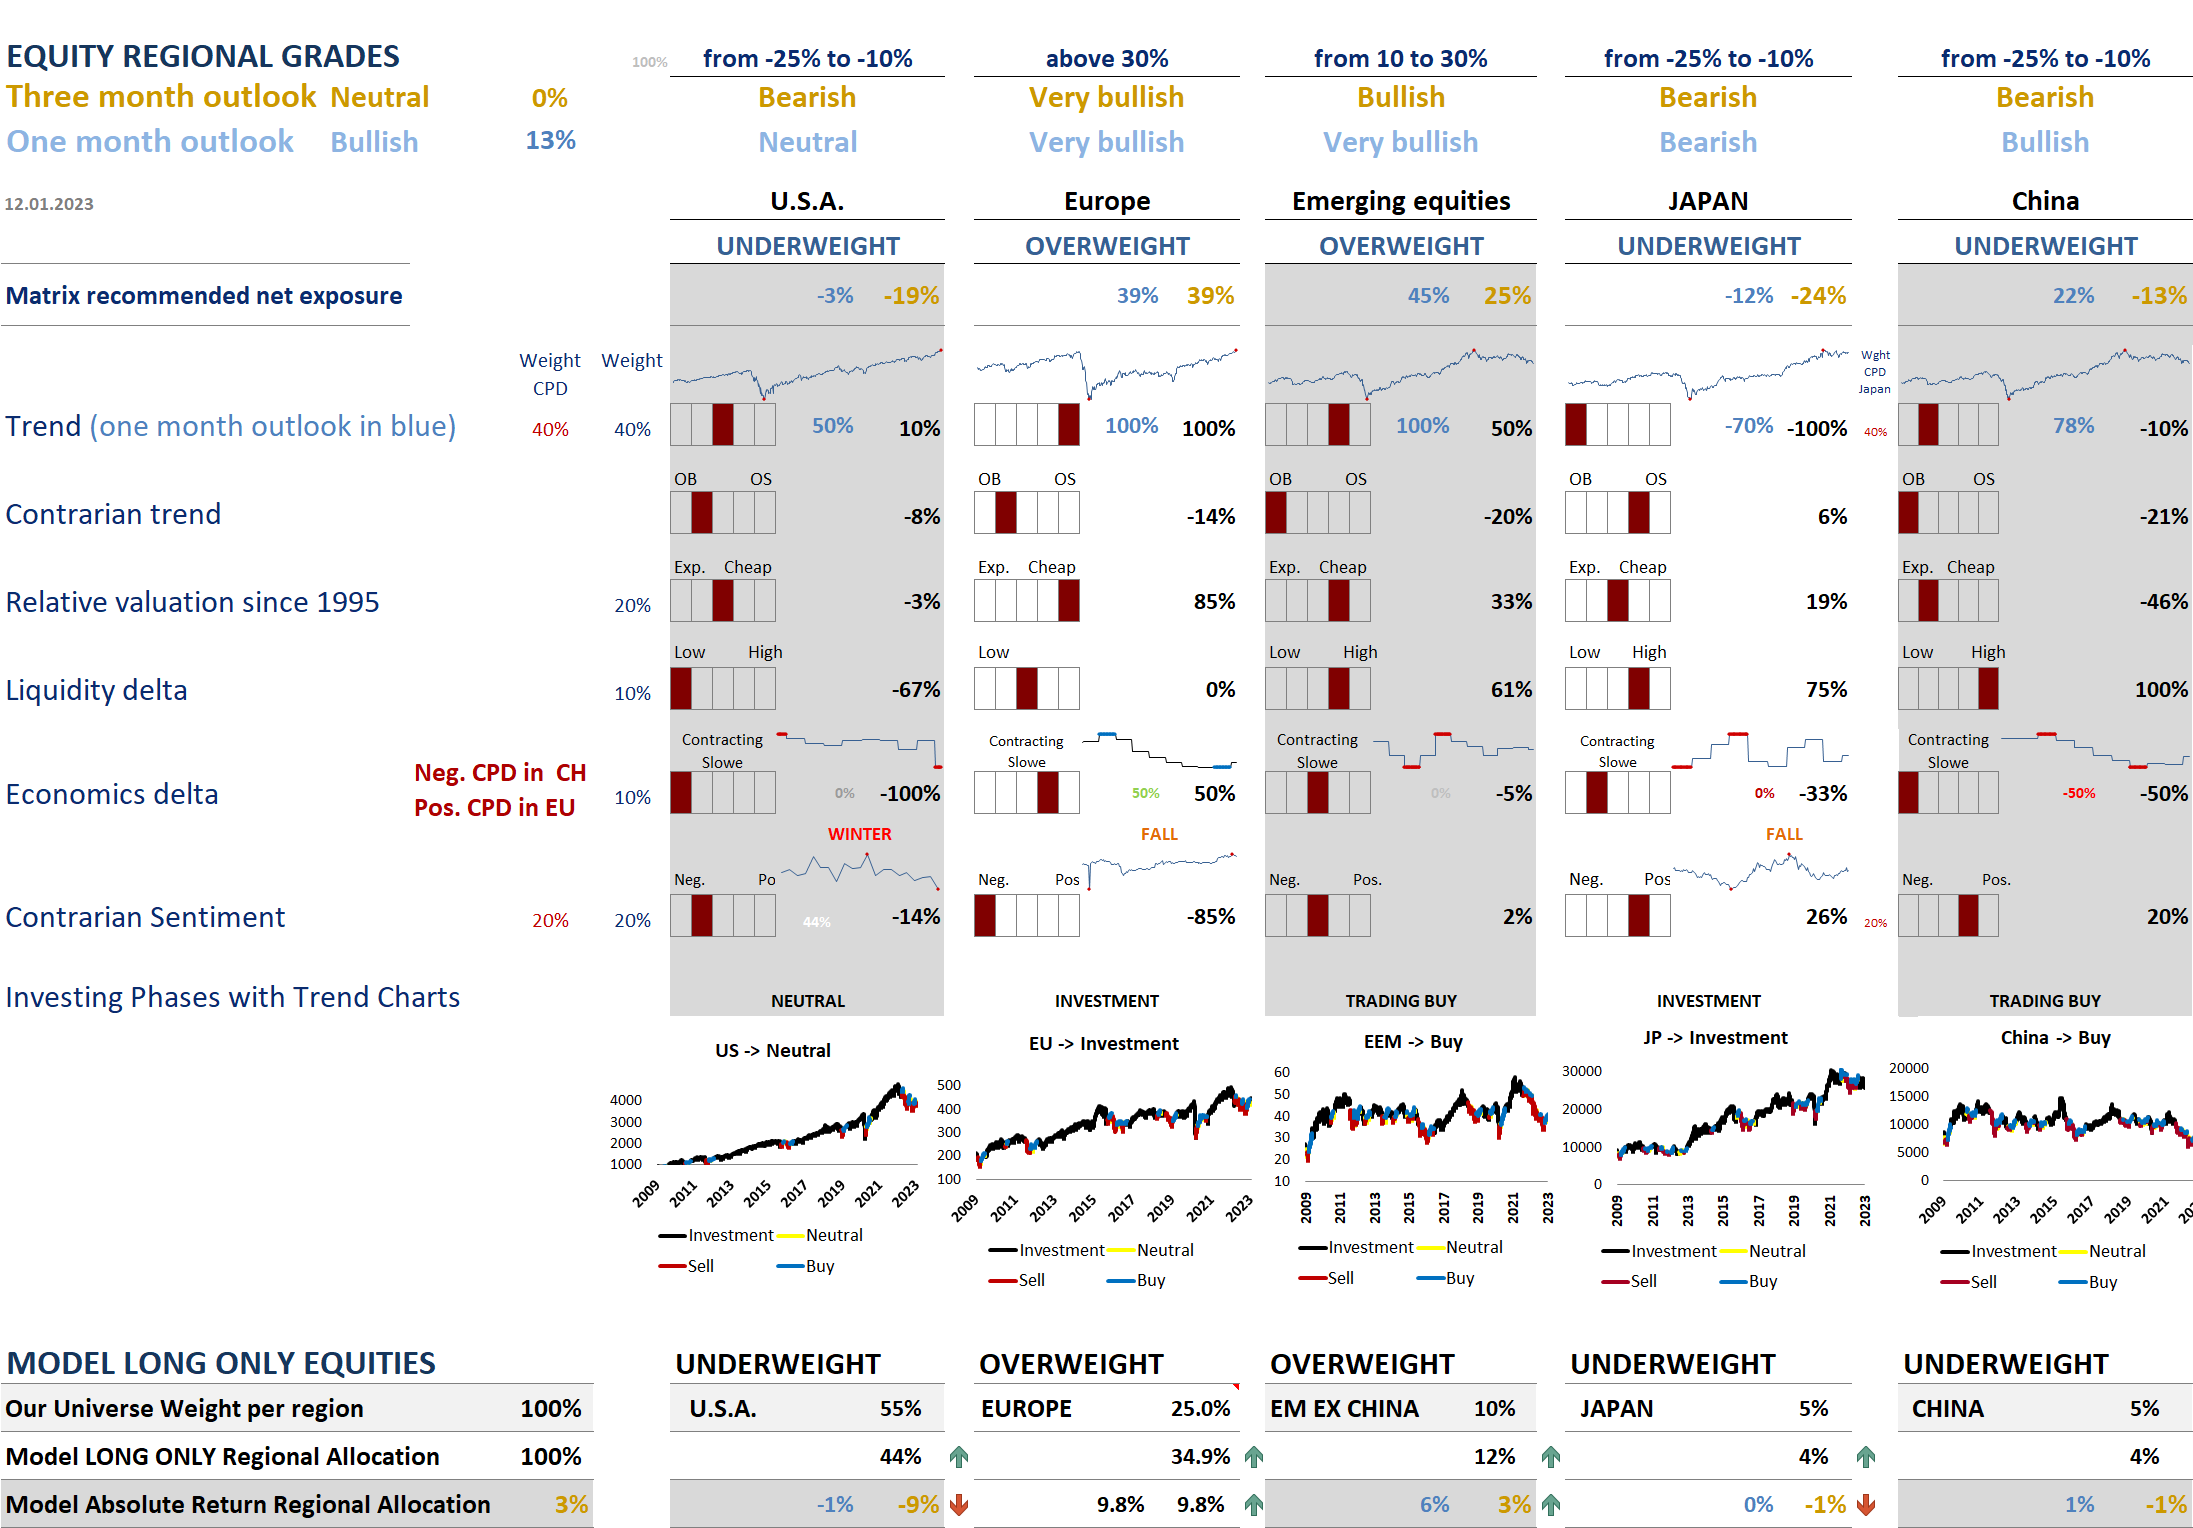
There are some discrepancies between regions. We think we are going towards a trough in the economic delta of global economics and the rate of change is firmly down, as is shown by the recent fall of the Economics delta grade in our matrix shown above. But unlike falling US economic data, Europe has seen a trough in its ugly PMI manufacturing, which is a contrarian signal in our Matrix’ economics grade. This is currently favouring Europe over the USA. but for how long. Valuation is also the most attractive in Europe and in EM countries. As this mixed situation is not preventing the Fed from hiking rates, it is creating a scenario “à la” 1970, when rate hikes are a drag on equities. On the chart below, we present a possible scenario for the S&P500 for the coming weeks: a non-consensual rebound towards the 200 days moving average, driven by another pivot belief, followed by a deep correction sometimes in 2023 (we favour the latter part of the year once the economic and earnings recession get closer).

What’s more, the Inverted Yield Curve is predictive of recession when Oil high and leading indicators so low. The chart below supports our conviction that we are ryhming with the 70s with probably the same consequences: lower equities (Europe, Japan and US), and a continued rotation from Expensive Growth to Low vol and value. Indeed, in the last 40 years, most inverted yield curves have been triggered by higher oil prices and collapsing heavy truck sales.

Disclaimer:
This marketing document is issued by Stouff Capital. It is neither directed to, nor intended for distribution or use by, any person or entity who is a citizen or resident of or located in any locality, state, country or jurisdiction where such distribution, publication, availability or use would be contrary to law or regulation.
The information and data presented in this document are not to be considered as an offer or solicitation to buy, sell or subscribe to any securities or financial instruments. Information, opinions and estimates contained in this document reflect a judgment at the original date of publication and are subject to change without notice. Any reference to benchmarks/indices herein are provided for information purposes only. No benchmark/index is directly comparable to the investment objectives, strategy or universe of Stouff Capital. For further information on the index please refer to the website of its service provider.
Stouff Capital has not taken any steps to ensure that the securities referred to in this document are suitable for any particular investor and this document is not to be relied upon in substitution for the exercise of independent judgment. Tax treatment depends on the individual circumstances of each investor and may be subject to change in the future. Before making any investment decision, investors are recommended to ascertain if this investment is suitable for them in light of their financial knowledge and experience, investment goals and financial situation, and/or to obtain specific advice from an industry professional.
The value and income of any of the securities or financial instruments mentioned in this document may fall as well as rise and, as a consequence, investors may receive back less than originally invested. The investment risks described herein are not purported to be exhaustive. Past performance is neither guarantee nor a reliable indicator of future results. Performance data does not include the commissions and fees charged at the time of subscribing for or redeeming shares. Investors investing in investments and/or treasury products denominated in foreign currency should be aware of the risk of exchange rate fluctuations that may cause loss of principal when foreign currency is converted to the investors home currency.
This document is confidential and intended solely for the use of the recipient. It must not be reproduced, distributed or published in whole or in part by any recipient for any purpose without the prior consent of Stouff Capital.