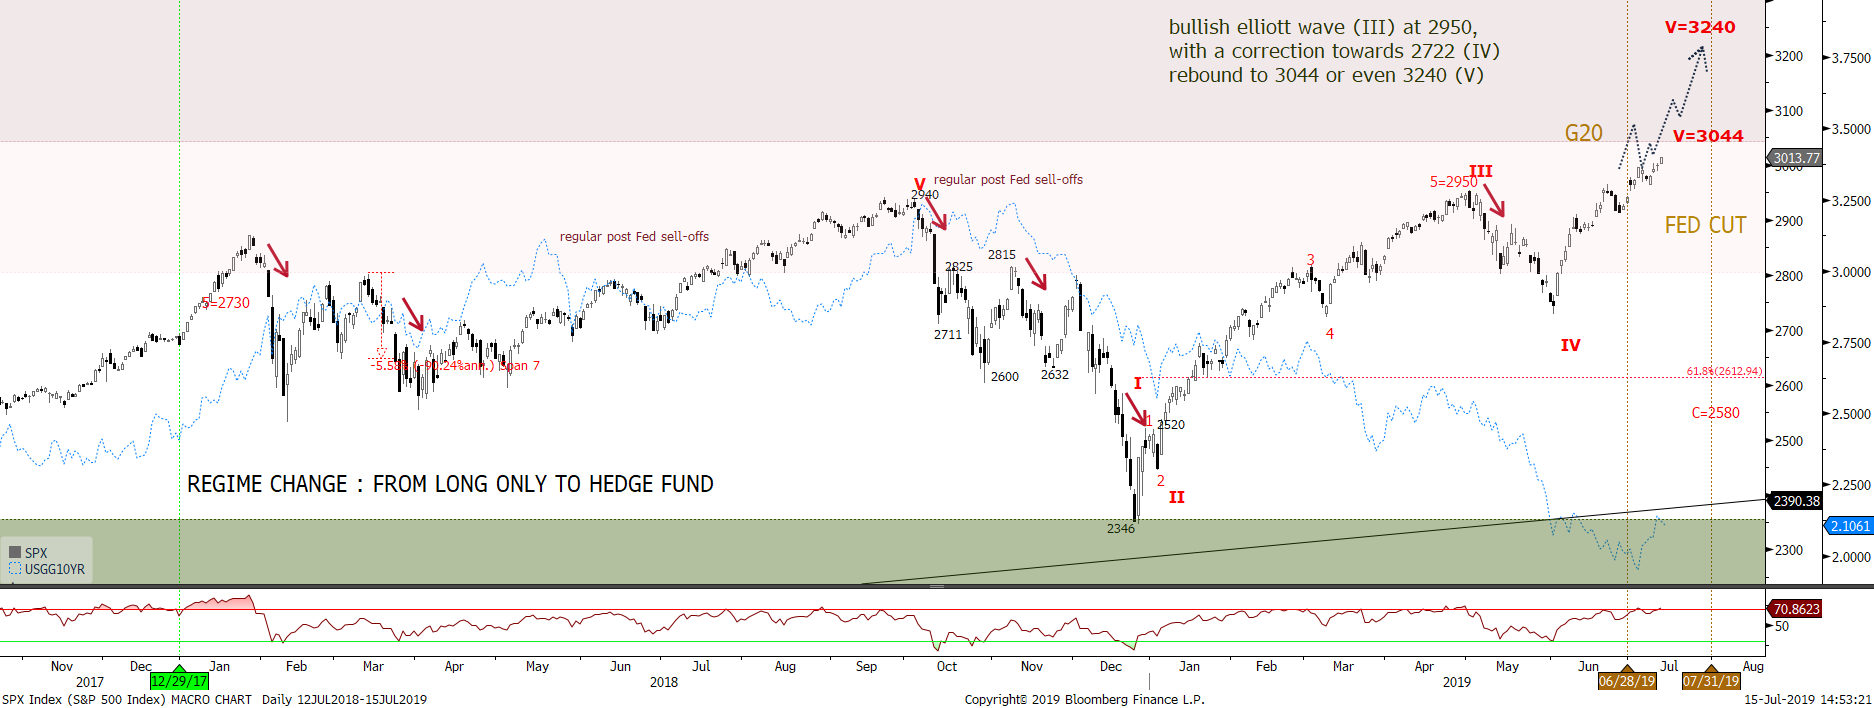
We believe we are at a very important crossroads right now. We have been articulating our trades since the end of 2017 in the context of a new market regime with higher volatility driven by political surprises (to be polite) and QT (quantitative tightening). After a massive bull run from April 2012 to January 2018, we suggested that global equities were about to enter a multi-year wide and volatile range trading. The S&P500 is now at the upper end of that 2350-3000 range once again, just like in January and September last year. The catalyst this time for a real breakout towards 3240 comes from the fact that all Central Banks [CB] are about to collectively embark on a policy of “bazooka” easing: with the Fed to lower its target range by 25 to maybe 50 bps on the 31st of July, and the ECB to lower the depo rate by 10bp on 25th of July. In the chart below, Nordea Markets uses artificial intelligence [AI] to read through all the FOMC’s minutes and computes a Fed Sentiment Indicator (see here). This is based on the language the Fed uses in statements, with a “dovish” bent meaning they are leaning more towards lower rates and easier monetary conditions.
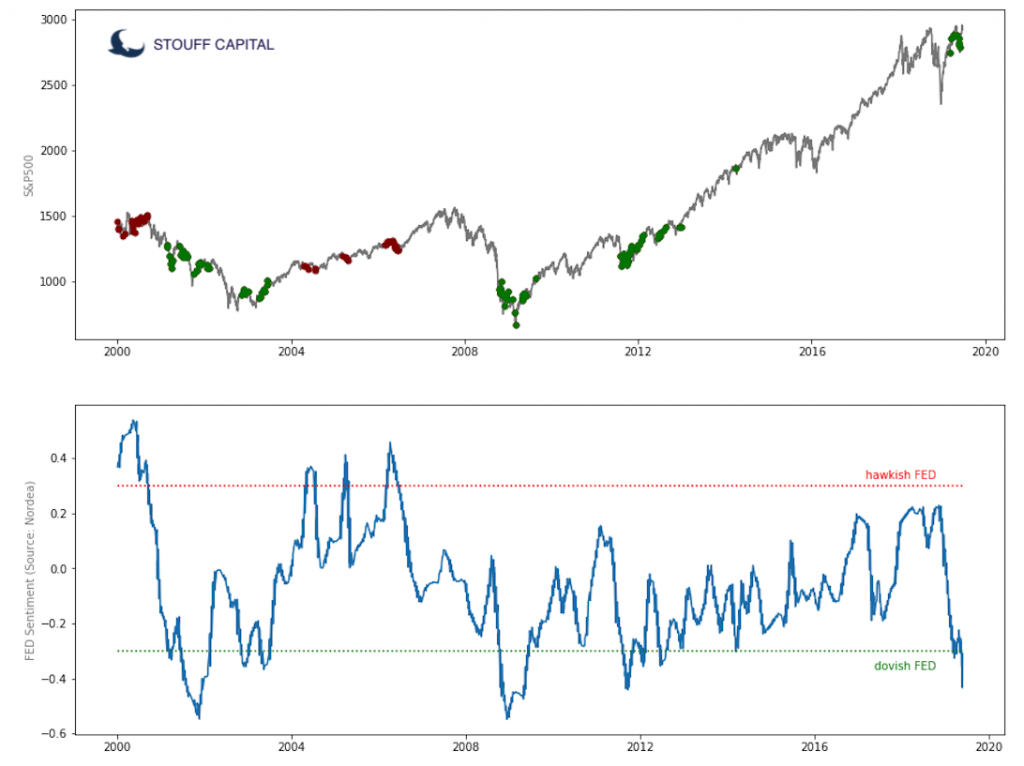
The current Fed sentiment Indicator is the most dovish since 2009 and 2012. Based on historical observations, when this indicator is below the -0.3 threshold (10% of time), the S&P500 is up more than 13% the year after, gold is up more than 20%, the dollar is down around 3% and long-term rates (10-yr note is down more than 1%) rebound as probably inflation expectations rise as a reaction function to ultra dovish conditions.
Based on this indicator, a rational exuberance could contribute to more PE upside, and the 3240 target on the S&P500 should be reached within a few months or even weeks. We can see above that extremely dovish Fed talk helped spur massive rallies in 2009 and 2012 [but wasn’t enough to stop the bursting of the 2000 Nasdaq bubble]. In essence, the Fed has possibly extended the bullish cycle by another two years, until the next US election with a possible target at 3500.
Indeed, in the psyché of investors, Circé (the return of QE), is creating a goldilocks environment for markets, which would propulse all the more bonds and equities to new highs, than the rosy case is supported by the Magnificent Seven. While, as this time, stocks are at their highs, and not in the middle of a climax selling, there is not the same risk-reward to make a bullish call at the top of the range. It requires all Magnificent Seven to check the boxes, that is:
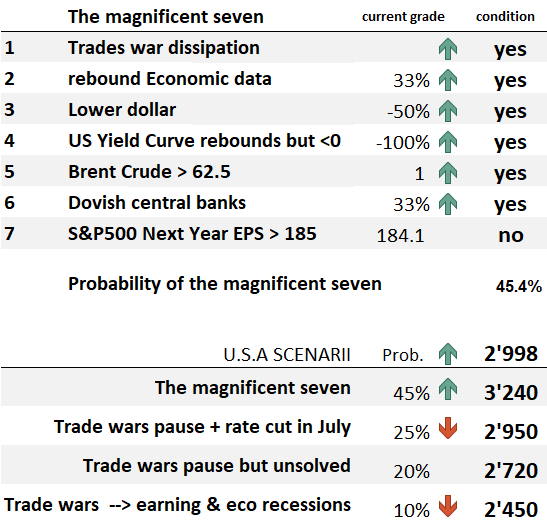
1- If the rate cut (check 6) is not associated with a further slowdown (check 2 and 7), but a reacceleration or stabilization in growth. The rosy view is that the global economy rebounds after having bent without breaking, in part due to CB easing. If a spillover from manufacturing to labor and services fails to intensify this summer, and if trade tariffs rise no more (check 1), insurance cuts would generate another lift. To the contrary, if this is the beginning of a full-blown rate-cutting cycle by the Fed in an attempt to ward off a recession like in 1990, 2001 or 2008, stocks won’t do well after the first cut. More globally, if CBs are just shooting their last bullets into an environment of weak growth and earnings momentum, this won’t be supportive of the breakout of the range trading.
2- If the spread between the 3-month and 10-year Treasury yields (check 4), which has been inverted for more than a month, ends its inversion, history tells us that this end to inversion must not mark an effective and terminal end. Indeed, the times when it was effective (meaning that the yield curve does not invert again in the coming weeks), the S&P’s average return and risk/reward ratio were negative by 6%, six months after; and since 1981 the four observations were all negative with May 2007 as a worrying comparison. To the contrary, the best outcome for stocks is when the yield curve turns around and becomes inverted again.
3- The dollar finally goes down. This is positive for US multinationals and for emerging equities. Both Japanese and European exporters should theoretically underperform but their recent strong de-rating owing to the trade wars would probably more than offset a lower dollar (US vs Europe 12M PE premium is at 23% or the highest since 2009, US vs Europe Price to Book Value premium is at 50% or the highest since the 70s). All in all, a lower dollar would be bullish for global equities.
A complex situation requires to dig in all details and look at local statistics, then to verify if a logical global scenario emerged. Let’s use our Regional Matrix [our top-down allocation model] as a framework (see here). The Regional Matrix is formed of six factors which are graded by our quantitative process. These are: Trend, Contrarian Trend, Relative Valuation, Economics Delta, Liquidity Delta, and [contrarian] Sentiment. It is based on a mix of momentum and contrarian indicators.
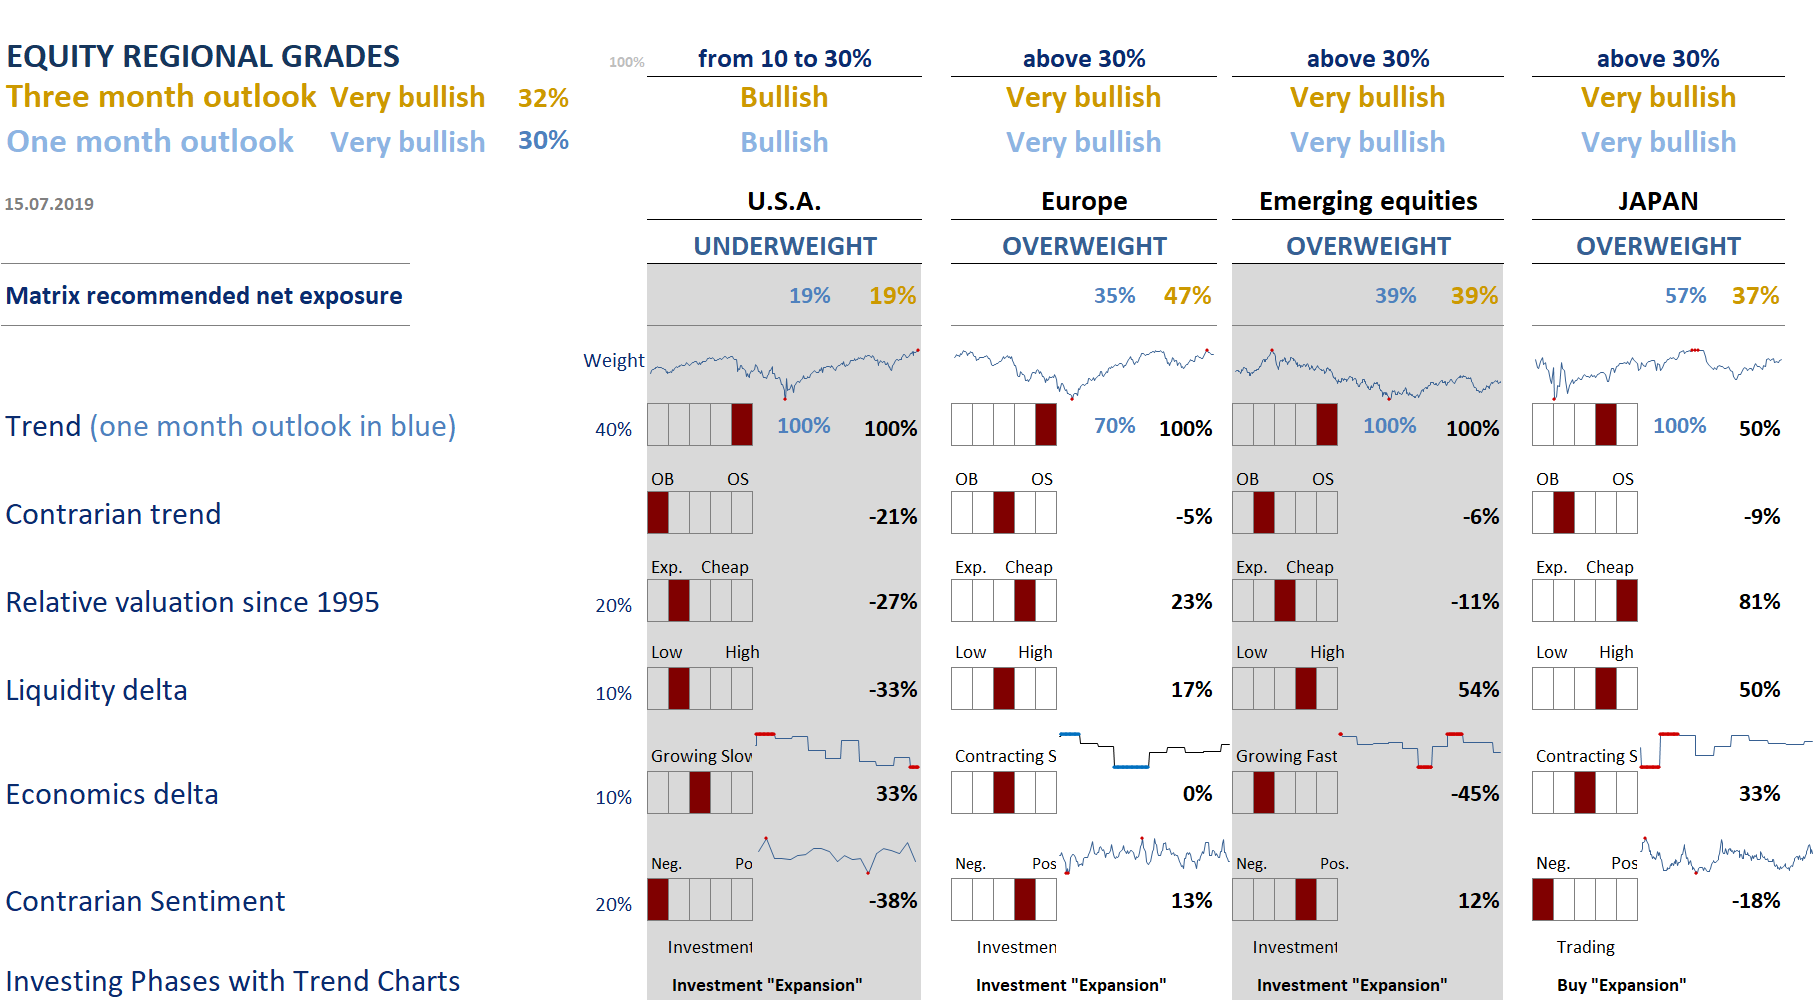
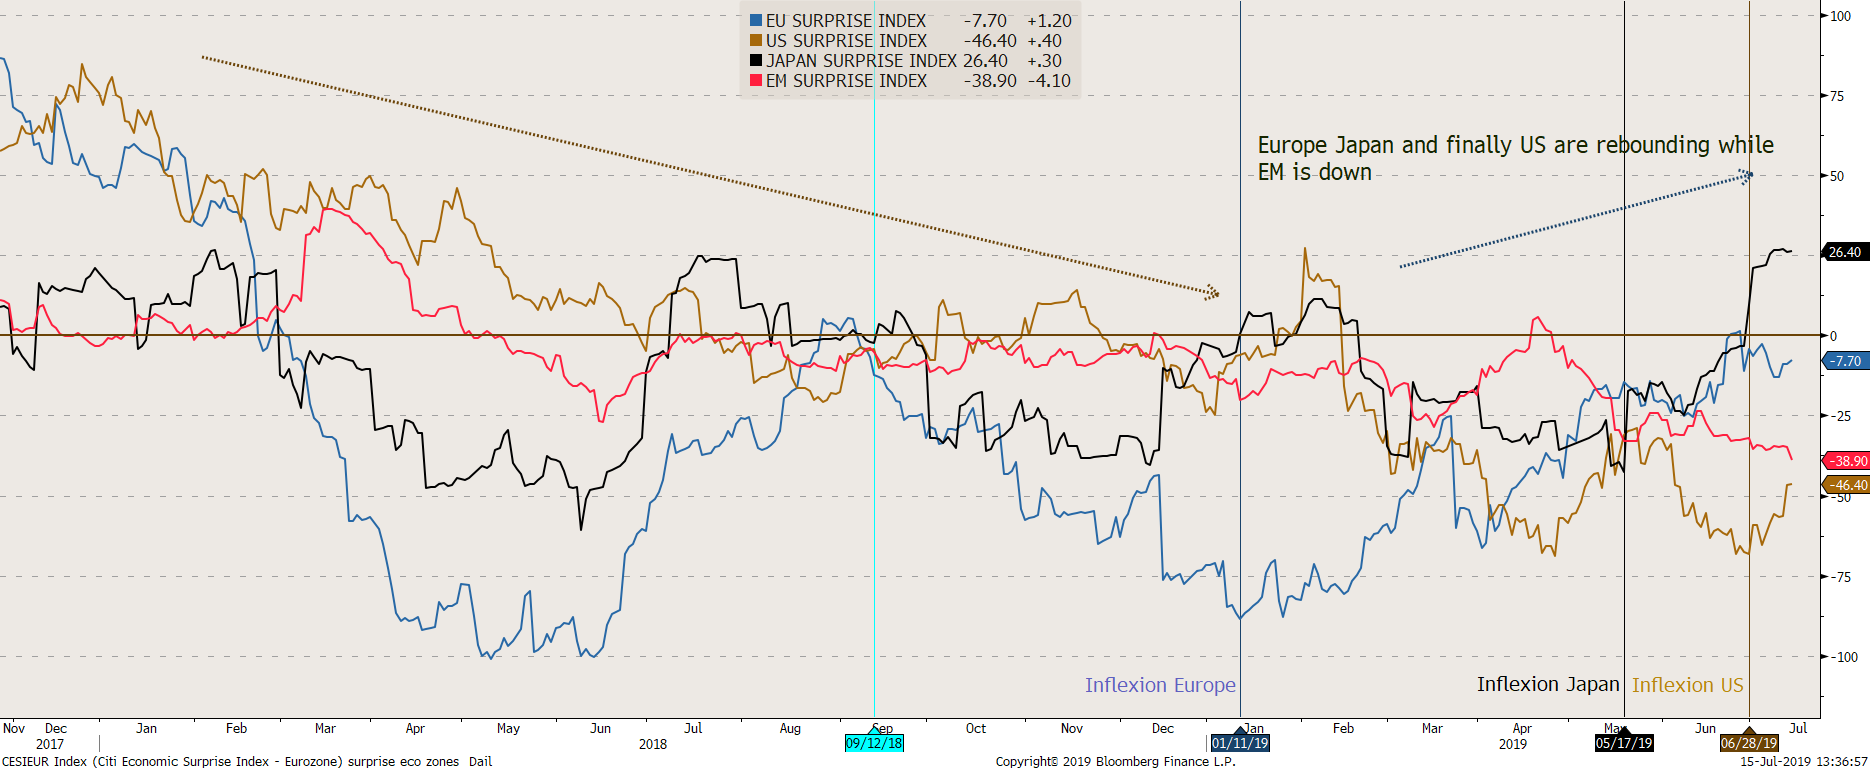
The Matrix is definitely bullish. Stocks still have material upside over the next 12 months driven by: rising liquidity under dovish CB, EPS growth as extreme negative earnings revision suggesting a strong rebound (see here), multiple expansion for European, Japanese and even US equities [US P/E premium to last 5-year average levels 20% lower than what was typically seen at past market peaks], and may be economic rebound as suggested by the recent upticks in Citigroup surprises indicators (see chart below).
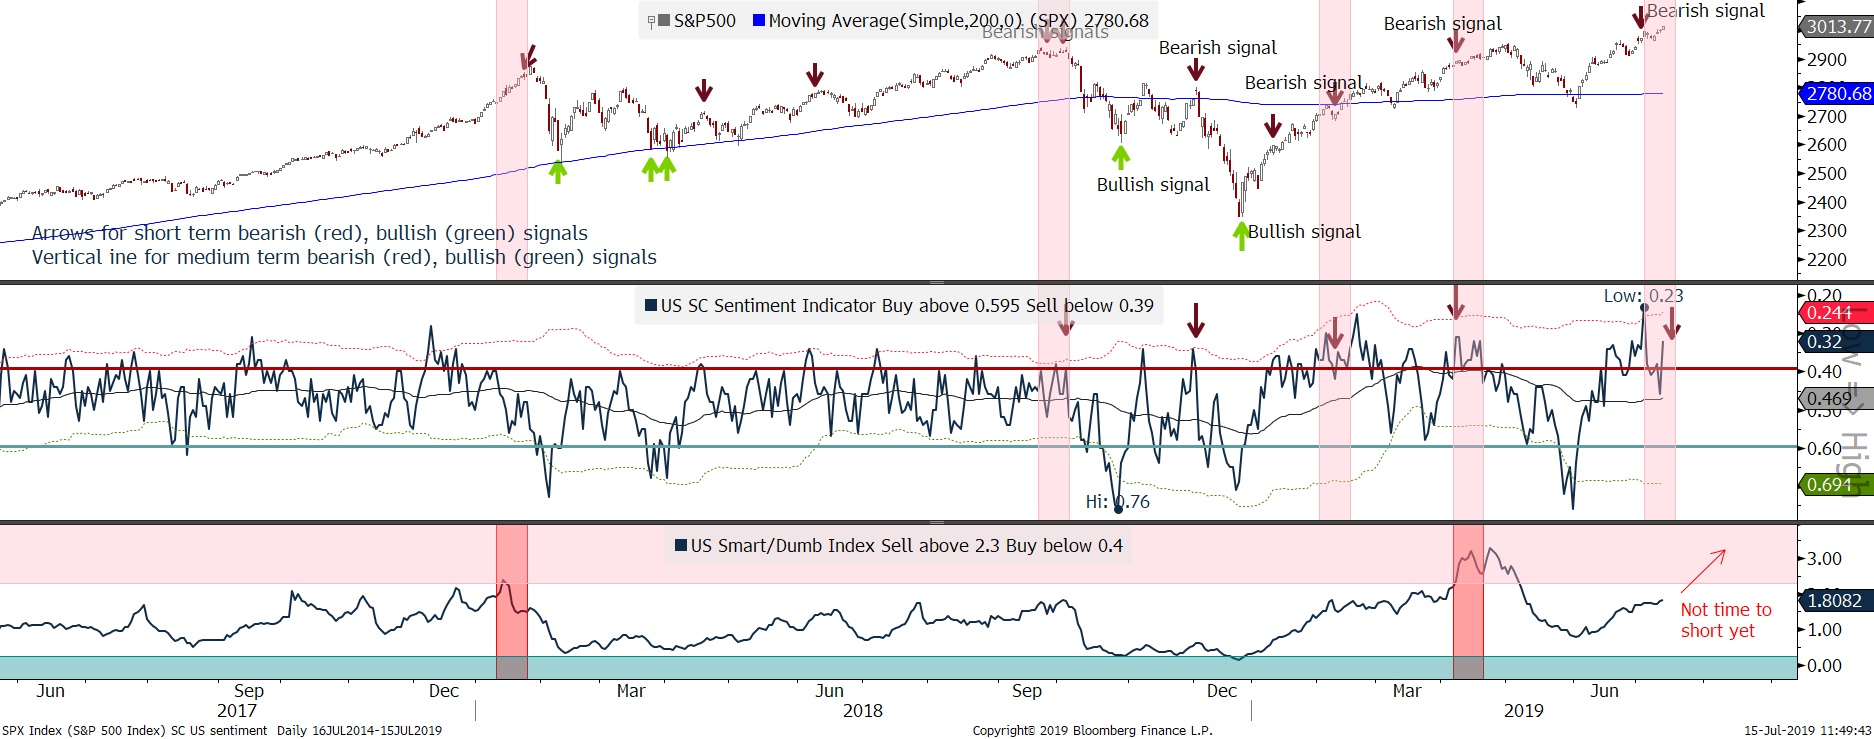
Only our US short-term sentiment indicators start to be stretched again, like in the end of April (see chart below). These sentiment grades are not yet confirmed by other surveys, higher cash weighting from European long-only (from 1.5% in 2018 to 3%), hedge funds low exposure (Equity Long/Short hedge funds holding well below-average exposure and European hedge funds with a 32% net exposure vs 40% from 2014 to 2017), not yet bearish medium-term contrarian Smart/Dumb indicator and ETF flows favouring Defensives over Cyclicals.
This explains why we do not yet anticipate an inflexion point, as we did by end-April and stay invested, but also why our contrarian approach currently articulates short-only on the bond-like proxies in equities (Real Estate, Utilities, Staples) and the Low-vol factor. We have been looking at sector performances in period of dovish CB actions, like after the famous ‘whatever it takes’ in summer 2012: Staples (Food & Beverages, Personal & Household Goods) under-performed for one year. That may seem counter-intuitive but after the very dovish action at that time, long term rates and long term inflation expectations found a floor. On a regional approach, our contrarian process also favours Europe and Japan to the detriment of US. We find German stocks particularly attractive from a contrarian point of view.
Parodos
As often, we treat binary outcomes with our preferred approach to optionality: convexity. While being fully invested in terms of net and gross exposure [with respect to our Matrix], to benefit from the Magnificent Seven reaching their mission to 3240 (see chart above), we simultaneously buy long-term low-delta put to be eventually hedged against another false signal triggered by the current rational exuberance. Indeed, we all know that the Magnificent Seven succeeded in their mission, but ultimately, five of them died. Let’s hope that even if the S&P500 manages to reach its 3040 and then 3240 targets, thereafter, it does not finish as badly, and returns to 2615 or even to the low band of the two years’ range.