Published on: 31 October 2019

We publish our main top down convictions on this website every two months. Through our Research website, members have also access to the explanation of our full process through bi-weekly letters, to our quantamental and purely quantitative portfolios and also to all our real-time trade ideas. On the first year anniversary of our global equity long/short strategy we write our first trade review – summary of performance of these trades, that delivered as of Oct 31st, +10.25% performance in 2019 and 11.31% since 1 May 2018. This has been achieved with a low net delta (between -10% and +25%), an annualized volatility below 5% and a gross exposure below 200%, thanks to a 70% win ratio. Those who would be interested to get a pricing for these tactical ideas can write to [email protected].
Our trades can be classified in 3 styles:
- Allocation trades are chosen out of our various quantitative portfolios (low vol/high earning growth, U2 [unloved & undervalued], IPO) and quantamental regional portfolios (SC US long & short list, SC European Long & Short stock list, SC Asia & Japan long & short portfolios, New ESG portfolio created & managed by Julia). The difference between the quantitative and quantamental portfolios is that pure quantitative lists are systematically constructed only by algos and rebalanced at least once a month, while quantamental are constanly updated based on the mix of algos and fundamental convictions
- Tactical trades are sent when our quantamental process identifies local or major inflexion points in the ongoing trend.
- Last but not least, we launch single stocks high conviction trades based on a mix of quantamental scoring (6 factors model weighted by the current market regime) and a list of technical signals which should improve the odds of success.
Trade Review
During the past 18 months (from May 2018 to October 2019) the performance of our theoretical trades has been very positive and certainly demonstrates that those recommendations are making money in a very conservative manner. For 2019, as of Friday 31st October, the return of our global equity absolute return portfolio is up +9.77%. The bulk of the performance is attributed to European equities with nearly a +5% contribution.
Below is the chart showing trades sent since September 2018:
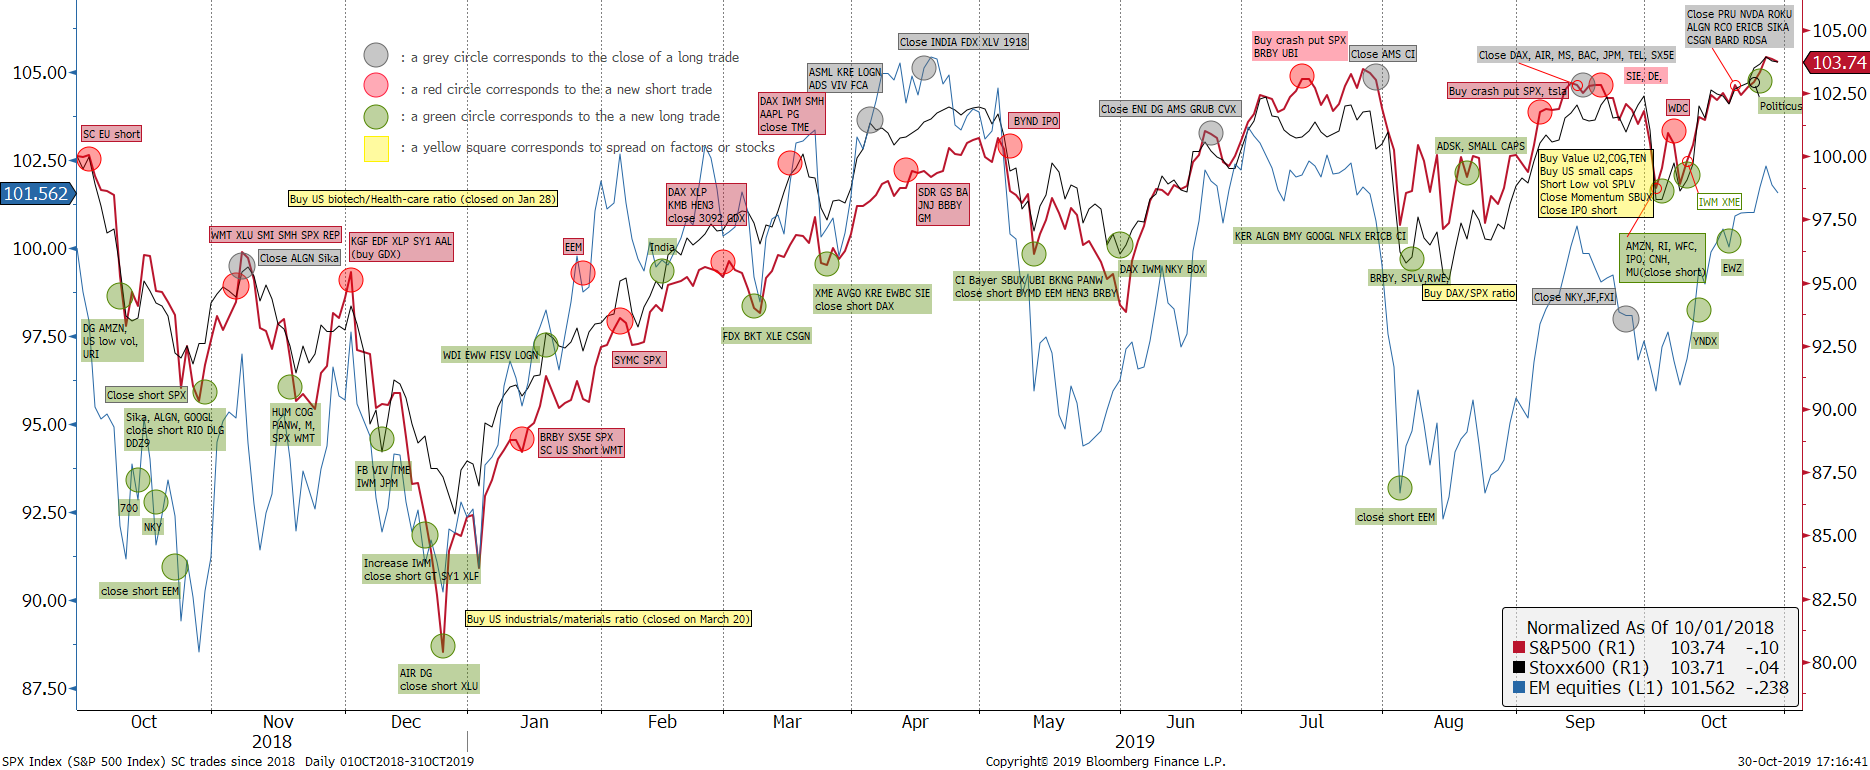
Shorts are coloured in red, longs in green, the close of longs in grey while pair trades are yellow coloured. One can observe that same coloured trades are clustered around specific periods. Part of the good performance comes from the fact that red and grey are mostly present in the local tops while Green in the local bottoms. While past performance does not guarantee future returns, we justify this efficient timing by the predictability power of our Contrarian Sentiment models in this market environment. Indeed, while our process is definitely based on momentum [in price but also fundamentals mainly through earnings momentum], our quantamental contrarian approach helps us master inflexion points.
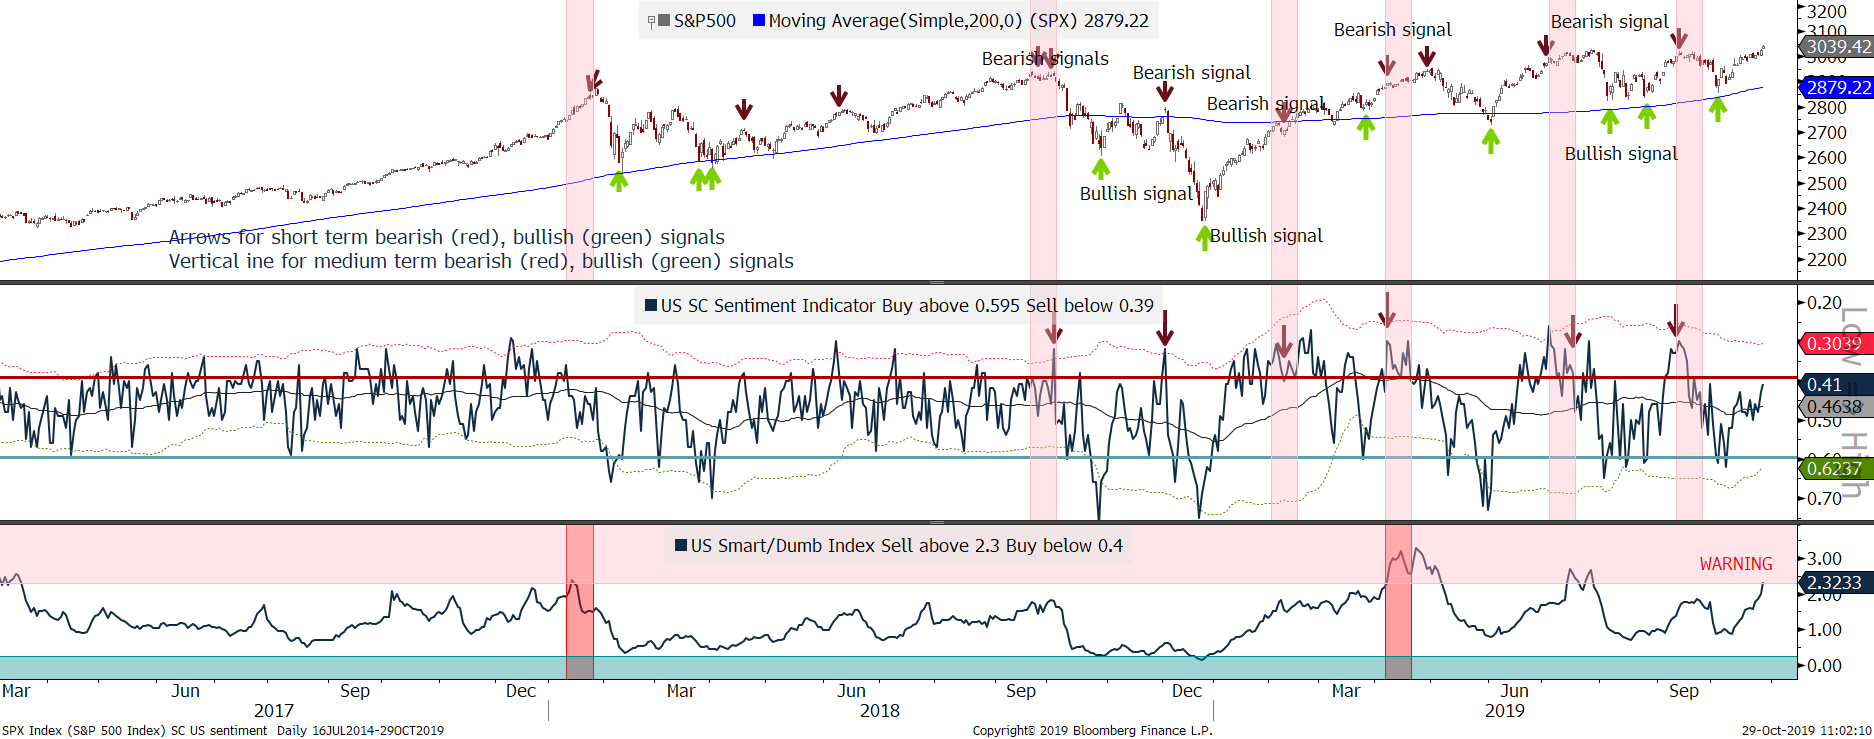
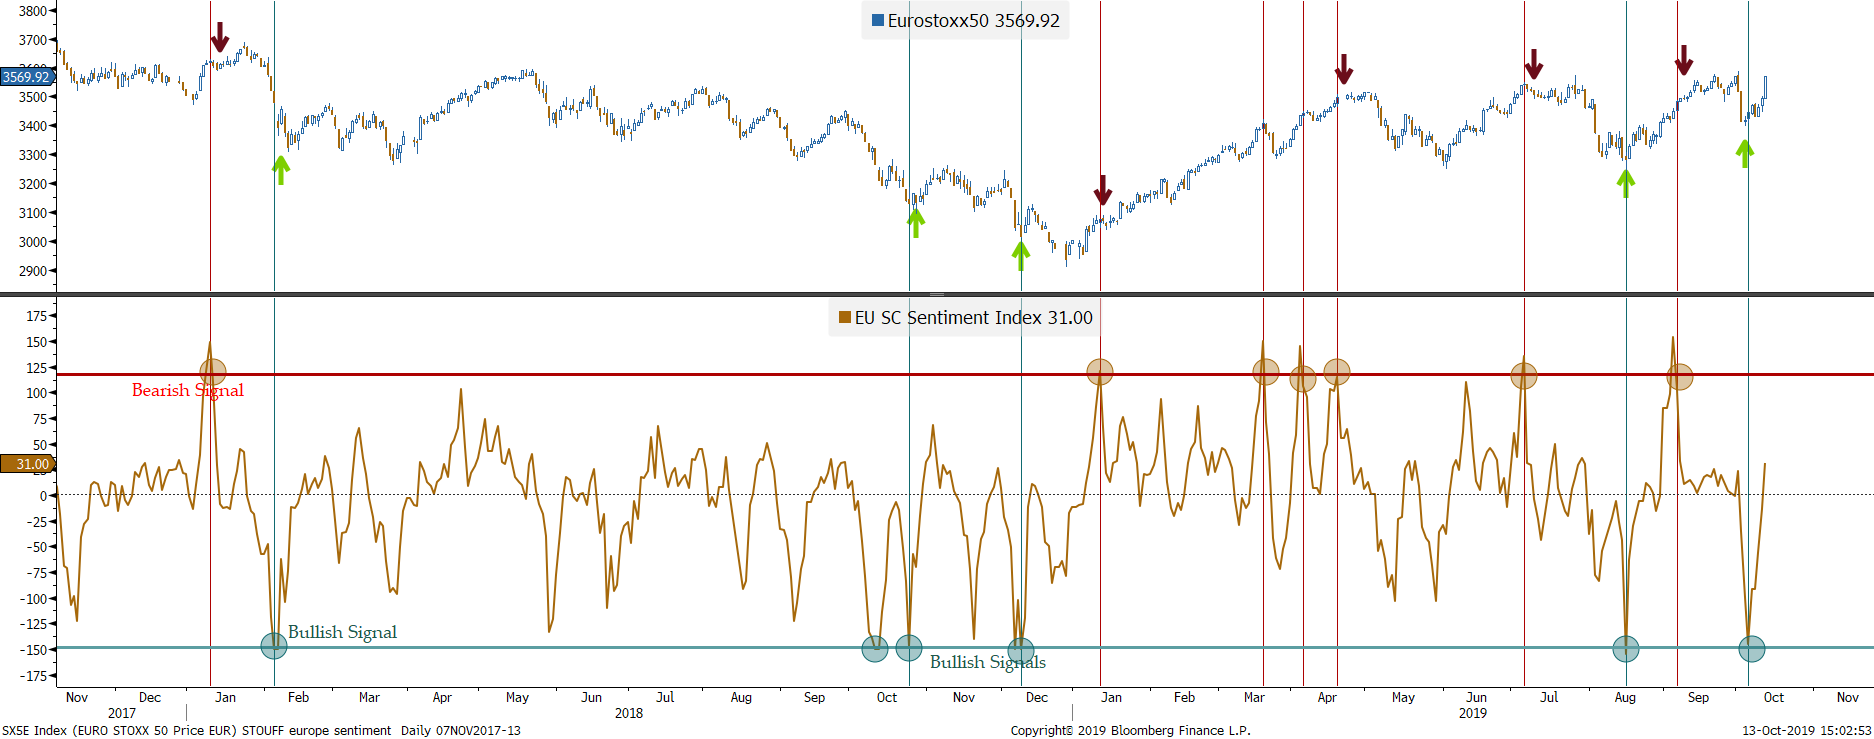
Top-down: inflection points via Contrarian Sentiment
To demonstrate how we anticipate inflection, the charts below show how our European & US SC sentiment indicator should be used to time the market. We made 3 major market calls in the last 12 months: (1) In December 2018, we make a bullish call while equities are in a panic mode (see more here); (2) At the start of May 2019, we become net short as explained in our blog here , based mainly on our contrarian approach as explained in details here ; (3) To the contrary, we became bullish in June as the consensual bullish market sentiment that we saw until the end of April switched to a very bearish one. We have stayed constructive on global equities since then as we explain in our last public view (see here).
Bottom-up stock selection: quanta-mental
Besides our market calls which calibrates the ratio of bullish versus bearish trades in our portfolio, the alpha is generated by the bottom-up stock selection. Our process relies on a mix of quantitative and quantamental portfolios. For instance, our quantitative Low-Vol / High-EPS strategy is built around a systematic process that combines the Earnings Momentum grade with a low-volatility filter. Needless to say that this strategy is our best-seller as it has outperformed as well the US benchmark by 100% since 2011 and by more than 10% since September 2018, than the European one by more than 8.5% since September 2018.
Our Quantamental portfolios have also generated significative alphas. The Long & Short European Quantamental portfolios have produced very strong alphas (European Shorts have produced +10% since October 2018 while Longs have outperformed its benchmark by 2.5%). Our Asia Long Quantamental portfolio has outperformed by 10% since October 2018. Then, our US Quantamental ESG list has generated +13% in the last 12 months.
The Short US Quantamental portfolio has produced +10.5% alpha since October 2018. Only the US Long Quantamental portfolio has recently lost its relative performance and underperformed by -5.5% owing to the rotation from momentum to value. This is why we have recently added new allocation to Quantamental portfolios that tactically outperform in these periods of rotation towards value: the U2 (unloved-undervalued) and the IPO portfolios. For the U2, we consider a large selection of European funds, and look at those sectors and stocks in which those funds are underweight compared to the respective benchmarks. This forms a list of stocks/sectors to which we apply our second criteria; we consider stocks scoring the highest in value component of our quantitative grade. This value grade is a proprietary formula: it is a ranking that takes into account various current and forward earnings, sales and market data designed to provide us with an unbiased holistic value indicator. A high value grade indicates a stock is ‘cheap’.
Please see charts for quantitative and quantamental portfolios performance here.
Single stock conviction trades
Last but not least, we articulate single stock trades when we identify high risk rewards technical signals on our lists of best and worst quantamental names. Below are Two examples.
On June 20th, we purchased AMS as a technical signal was supported by a mix of strong quantitative grades. Indeed, our predictive Earnings momentum grade (Blue grade at 89 on left axis) rose above 60. Our target was reached in the coming weeks and was the top going forward:
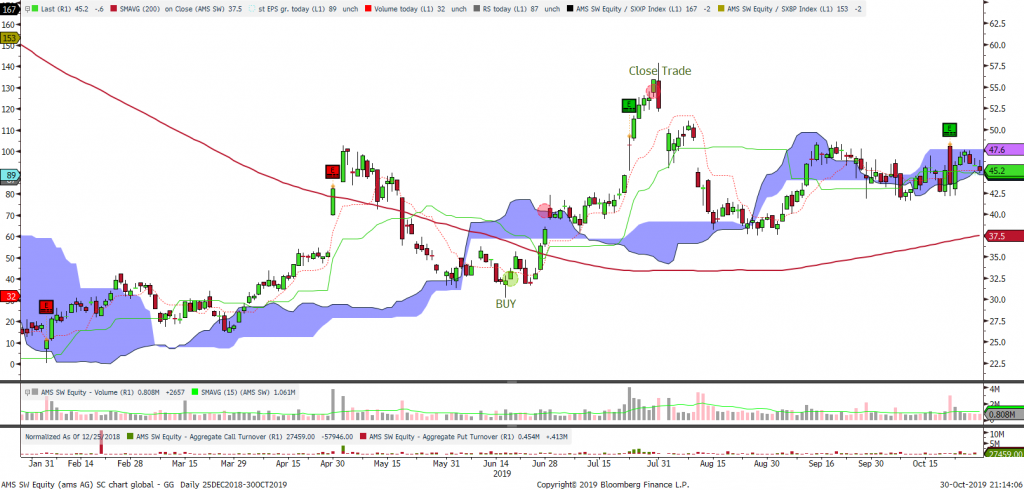
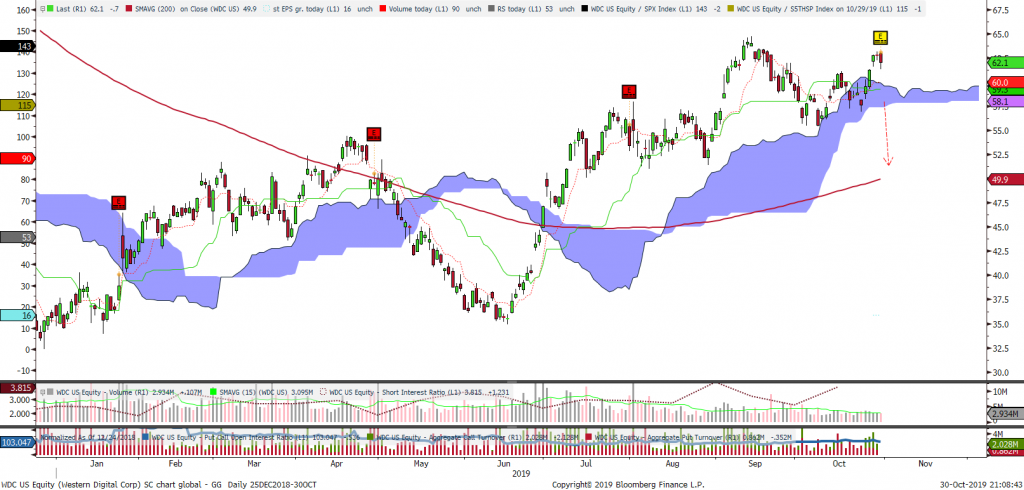
In US, we recommended a theoretical Short trade on Western Digital (WDC US), which had the worst mix of quantitative grades in our global universe (Left axis blue-coloured mark at 16) :
Outlook for the coming months
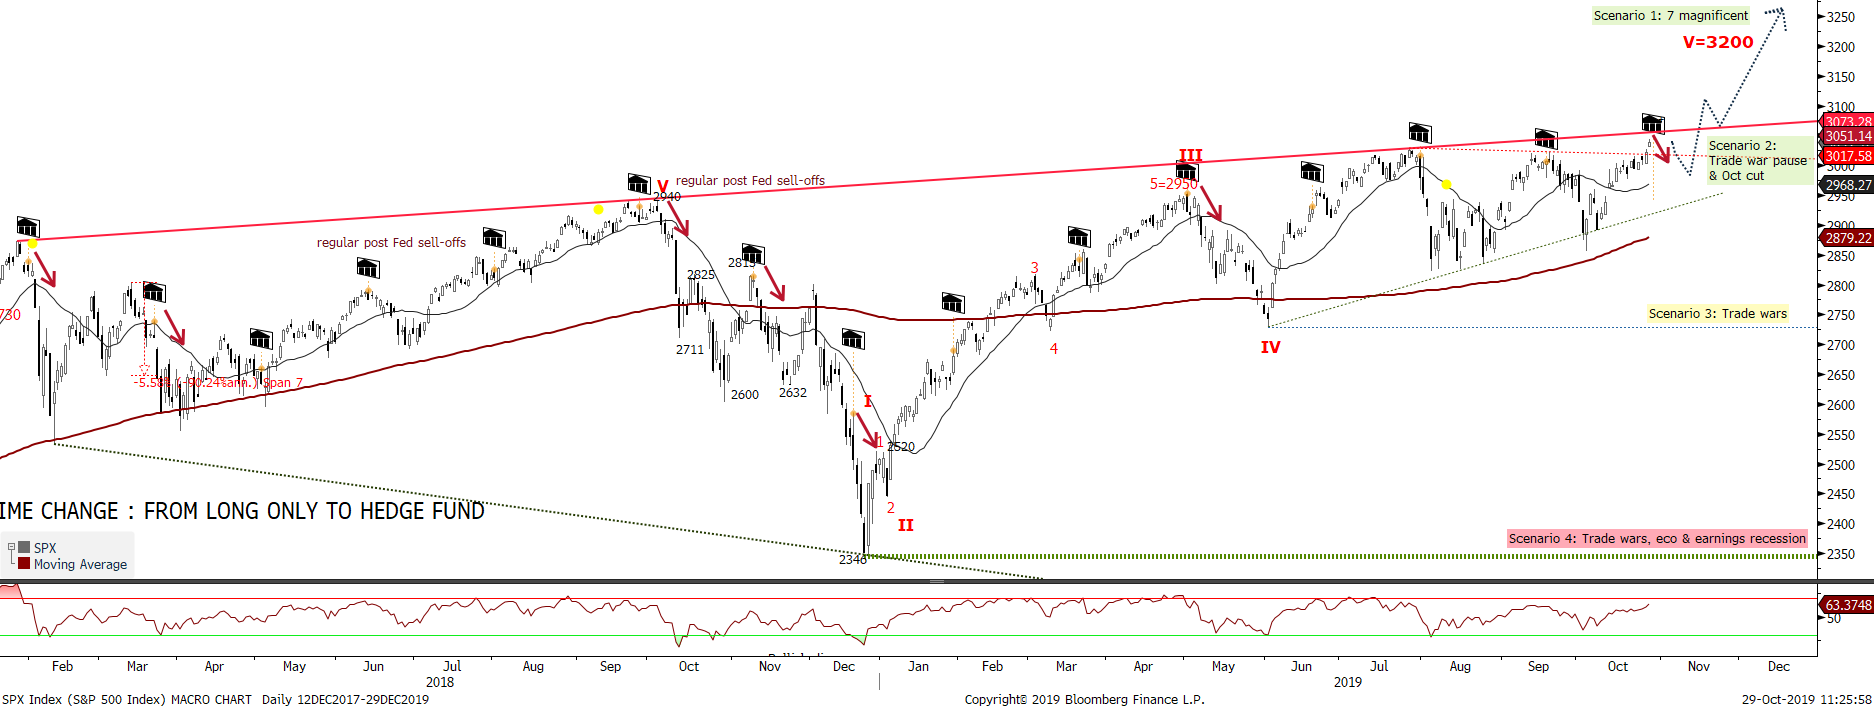
We expect a continuation of the rebound in equities driven by the global Central Bank’s new dovishness (Boj and ECB with negative rates, a more dovish Fed) and a rebound of economic data. We expect the S&P500 to rhyme with 1998 and breaks out towards 3200 after having consolidated since June.
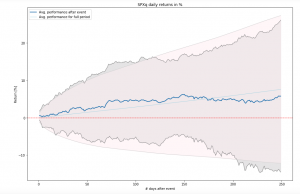
Following mixed US data (bad Services PMI but rebounding Manufacturing PMI), other regions have all had better PMI Services. And Europe may have seen a trough in its ugly PMI manufacting, which is a contrarian signal in our Matrix’ economics grade. As this mixed situation is not preventing the Fed from cutting rates, it is creating a scenario “à la” 1998, when 3 rate cuts propelled equities in a climax buying 2 years later. Following the last Fed meeting, Powell suggested the Fed’s policy actions have already supported the economy, the labor market, and household spending. The Fed is seeing more clearly the effects of its policy accommodation, especially on interest sensitive sectors, along with the consumer. We think we have gone already through a trough in the economic delta of global economics and the rate of change is now up, as is shown by the recent rise of the Economics delta grade in our matrix shown below. The chart on the right shows how performance of the S&P500 gets much better (up 14% after 6 months which would bring the index to 3450) after 3 rate cuts but no more than 1 left.
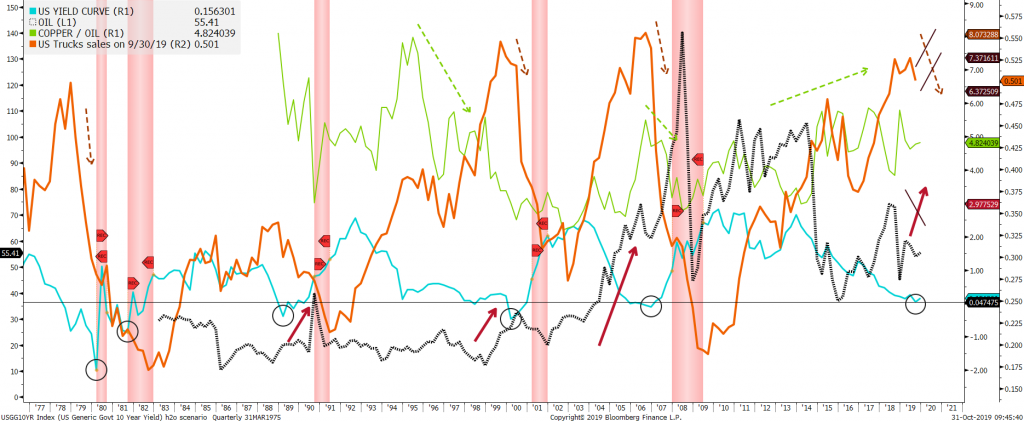
What’s more, the Inverted Yield Curve is not predictive of recession when Oil low and leading indicators strong. The chart below which has been inspired by Bruno Crastes from H2O, is making the point and supports our conviction that we are ryhming with 1998 with probably the same consequences: higher equities (Europe, Japan and US), strong Dollar, and a continued rotation from Low vol to value. Indeed, in the last 40 years, most inverted yield curves have been triggered by higher oil prices and collapsing heavy truck sales. To the contrary, the current inversion is more a Consequence of foreign bond purchases as US yields are the only liquid high yields Worldwide than a recession forecaster. This is confirmed by an Inversed yield curve while there is neither an Oil shock, nor a collapse of advanced domestic indicators such as the heavy truck sales.
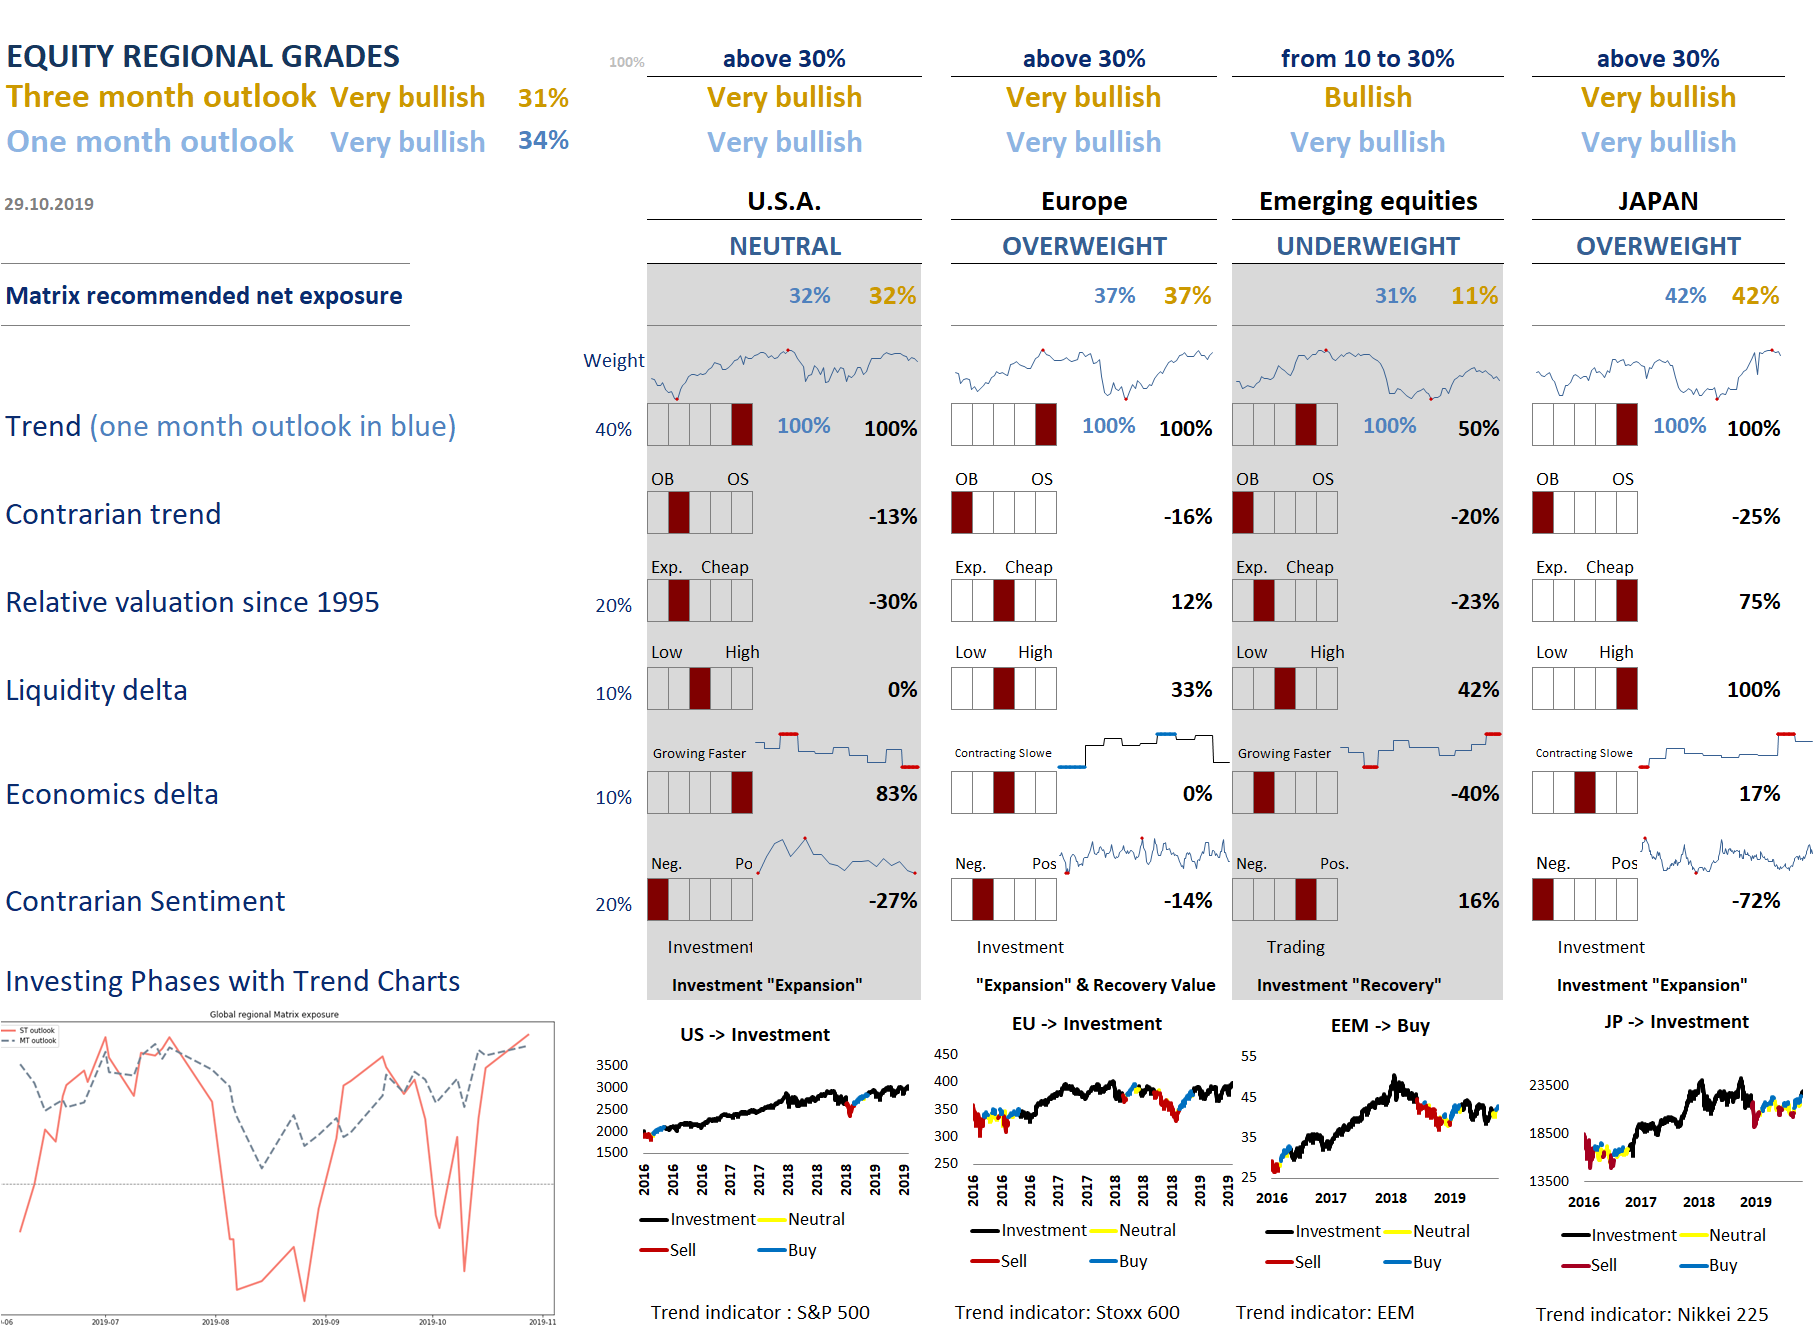
Our quantitative process through our Regional Matrix ( see below chart) has become even more bullish on one and three months outlooks. Three weeks ago, the market was oversold, and the trend was not broken. As of last Friday, global equities have broken out. We expect the Fed to keep decreasing rates before markets realize that macroeconomic data rebounds. We observe a confirmation of this break-out with the recent outperformance of US & European financials and the underperformance of defensives like Utilities in US or staples in Europe. We also anticipate a rebound of stocks with a strong ‘Growth Factor’ to support this last leg up of global equities (the correction in softwares has reached the historical drawdown level of prior crowding unwinds). On the earnings front, they are better than expected after a big week of 3Q prints in the US. Regionally, Europe and Japan stay overweight after their recent outpermance while US is neutral and EM still underweight.
To finish, just a small warning ! Tactically, many measures of investor risk-aversion have become much less cautious in the last two weeks. This rebound in risk sentiment could create a small classic correction after the fed meeting, which we believe would offer another entry level.
Disclaimer:
This marketing document is issued by Stouff Capital. It is neither directed to, nor intended for distribution or use by, any person or entity who is a citizen or resident of or located in any locality, state, country or jurisdiction where such distribution, publication, availability or use would be contrary to law or regulation.
The information and data presented in this document are not to be considered as an offer or solicitation to buy, sell or subscribe to any securities or financial instruments. Information, opinions and estimates contained in this document reflect a judgment at the original date of publication and are subject to change without notice. Any reference to benchmarks/indices herein are provided for information purposes only. No benchmark/index is directly comparable to the investment objectives, strategy or universe of Stouff Capital. For further information on the index please refer to the website of its service provider.
Stouff Capital has not taken any steps to ensure that the securities referred to in this document are suitable for any particular investor and this document is not to be relied upon in substitution for the exercise of independent judgment. Tax treatment depends on the individual circumstances of each investor and may be subject to change in the future. Before making any investment decision, investors are recommended to ascertain if this investment is suitable for them in light of their financial knowledge and experience, investment goals and financial situation, and/or to obtain specific advice from an industry professional.
The value and income of any of the securities or financial instruments mentioned in this document may fall as well as rise and, as a consequence, investors may receive back less than originally invested. The investment risks described herein are not purported to be exhaustive. Past performance is neither guarantee nor a reliable indicator of future results. Performance data does not include the commissions and fees charged at the time of subscribing for or redeeming shares. Investors investing in investments and/or treasury products denominated in foreign currency should be aware of the risk of exchange rate fluctuations that may cause loss of principal when foreign currency is converted to the investors home currency.
This document is confidential and intended solely for the use of the recipient. It must not be reproduced, distributed or published in whole or in part by any recipient for any purpose without the prior consent of Stouff Capital.