Published on: 20th july 2020
We last published our main top down convictions on this website a long time ago in december 2019. The bottom right handed chart shows that we expected a small correction towards 3,130 followed by the ultimate wave V rise of the 9 years bull market culminating between 3,555 and 3,740.

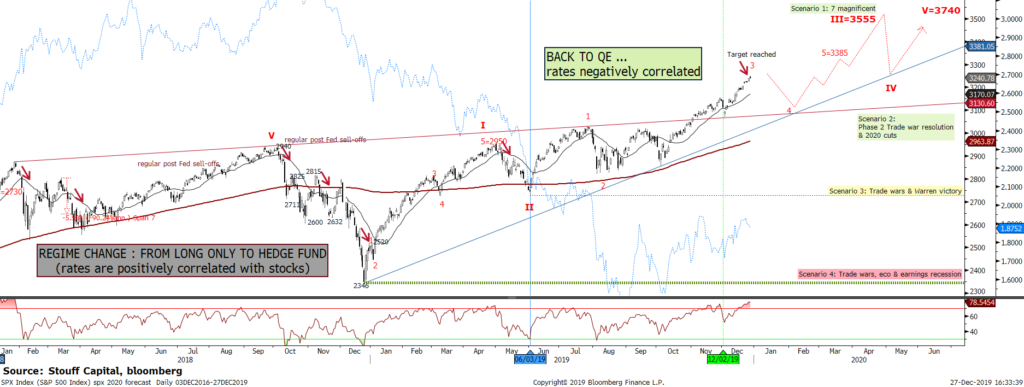
Being right for trivial and technical reasons at the start [at least until the date the S&P500 fell to 3,130 on the 25th, february], we have rarely been that wrong thereafter. When the local Chinese Coronavirus crisis spread to a pandemic, global equities underwent their worst market crash since 1987, with the MSCI World losing around 35% in just a month.
However, our costly mistake has been followed by the right conviction in a V rebound for economic and markets. Indeed, after a massive injection of liquidity by central banks associated with historical fiscal plans (EU sovereign fund, Chinese and US stimulus) global equities are now just 5% below the pre-crash level. Some equity indexes have even recouped their losses like the DAX and the S&P500, or even better have strongly risen like the Nasdaq benefiting from the confinement. After this roller coaster, what could happen in the coming weeks ? In our July webinar, we present our tactical views but start with strong long term convictions. Indeed, we think the Covid-19 has ended a cycle with the deepest but probably shortest recession since 1929. A new cycle may have started in April, with a new equity long term bull market, with exhuberant traits, like in Wonderland, the dreamt world of Alice. We compare Lewis Carroll masterpiece Alice’s Adventures in Wonderland with the current financial situation, as what would have been nonsense in the past could become normal in the near future, just like in Alice’s dreams.
“ If I had a world of my own, everything will be nonsense ” ― Lewis Carroll, Alice’s Adventures in Wonderland & Through the Looking-Glass
You can watch our video (click here) on how the Covid 19 fiancial debacle and revival has been interpreted by our Quantamental approach. Then, a second video (click there) presents the main long term convictions we exposed in our last webinar, retouched by Achylles. The main charts of the webinar with a few explanations are below:
The main convictions for 2020 onwards
.

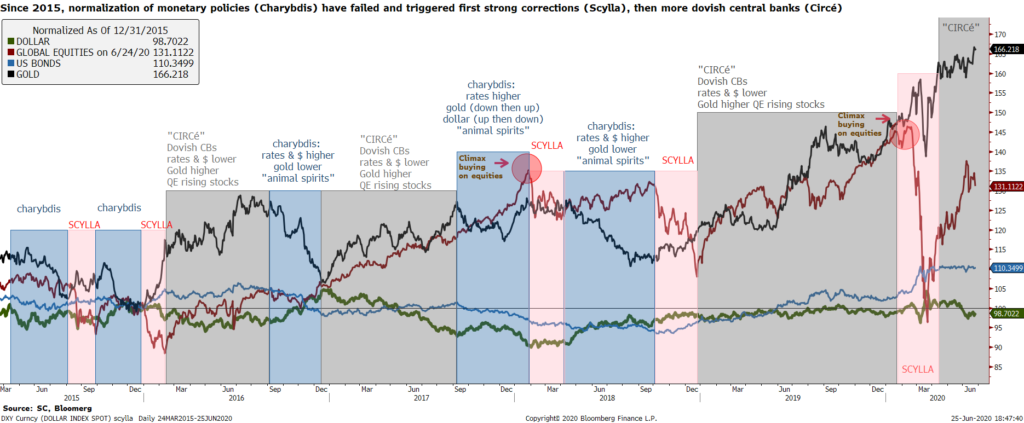
Since 2015, Central Banks have tried to restore a normal economic world by normalizing monetary policies “Charybdis”, systematically triggering strong corrections “Scylla” (evitata Charybdi in Scyllam incidi), and finally gave up by going always more accommodative “Circé”.
We have elaborated since 2015 a market paradigm (see here), which is a reaction function of 4 assets [gold, equities, dollar, T-note] for the trials of monetary normalizations. This paradigm is inspired by the odysseus of Homer when Ulysses tries to escape from the grisps of the druggist sorceress Circé (analogy for the Central banks) but must cope with two evils, Charybdis and Scylla. The chart below shows the 3 phases corresponding to (1) Charybdis [normalization of monetary policy] in blue, when gold, bonds fall, the dollar rises and equities are volatile: (2) Scylla in pink [market crash triggered by the restrictive monetary trials] , when gold, the dollar and bonds rise and finally (3) Circé in grey when the dollar falls but all 3 assets rise strongly. We think the “Circé” phase is here to stay for a long time before central banks dare normalizing again.
Chart 2: Between Scylla and Charybdis & Circé
With Covid-19, Central Banks have increased balance sheets limitless to provide money for massive fiscal policies [EU taboo recovery fund, MMT, negative taxation], by ricochet propelling financial markets in Bubbleland.
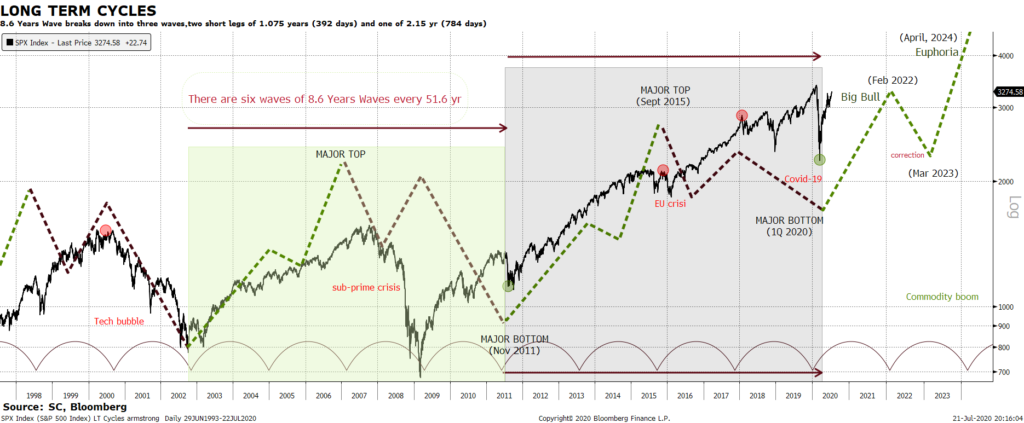
We think these actions would mark a new economic cycle. The chart below draws the Economic Confidence Model, created by Armstrong. While this model is not conceived to to anticipate market moves, it has coincided with major market inflections in the last 20 years: top of the tech bubble in 2000, bottom of equities in 2003, top in 2007 corresponding to the real estate turning point, rally of 2011-2015, volatile consolidation of January 2018 to 1Q 2020. According to the ECM, the bearish business cycle has bottomed in 1Q, 2020 and an 8.6 years cycle in 3 waves has started.
Chart 3: The economic confidence model forecasts a new 8.6 years business cycle
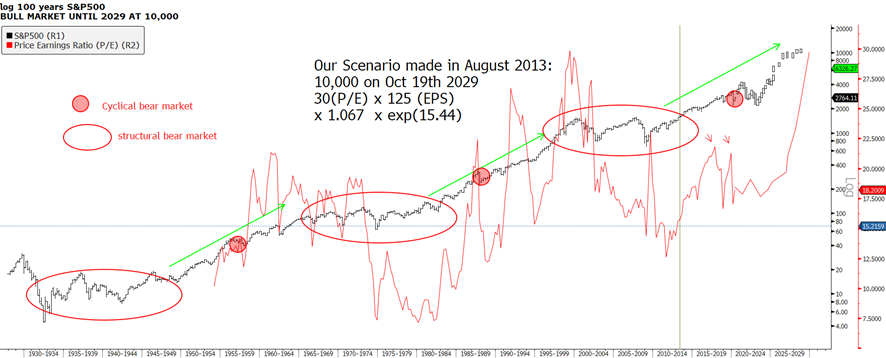
In terms of the S&P500 performance, this new 8.6 years business cycle could line up with a rise towards 6,000 in 2024 and 10,000 in 2029, just one century after the 2029 crash. Time will tell… The chart below shows an extrapolation of the S&P500 since 1920, with 3 major two decades long bull markets (47-69, 81-00, 09-??), interrupted by 3 one decade long bear markets (30s, 70s, 00s). The current bull market could rhyme with the two previous ones, suggesting a top at 10,000 in October 2029. 10,000 could be fundamentally justified by a 6.7% year earnings growth with a terminal P/E at 30.
Chart 4: Scenario for the S&P500 based on 100 years (in log)
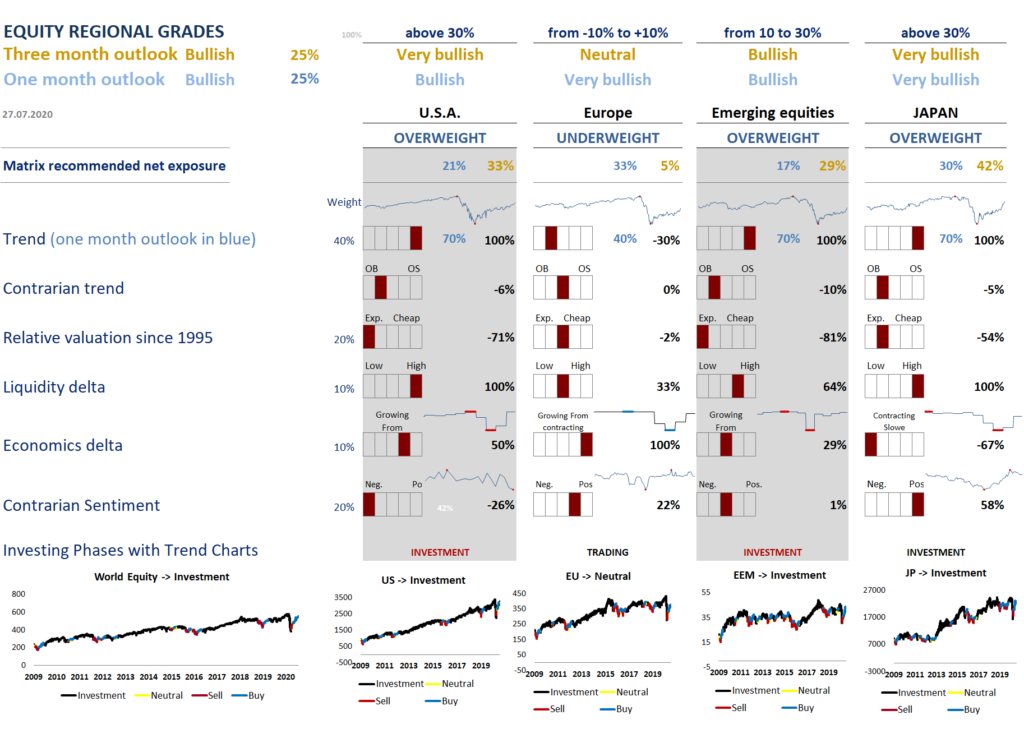
Our quantitative process through our Regional Matrix ( see below chart) is currently confirming those long term views as it has become bullish on one and three months outlooks. Global equities have broken out their 200 days moving average. All regions except Europe are back in an Investment phase.
Table 1: The Regional Matrix is bullish for the short and medium run
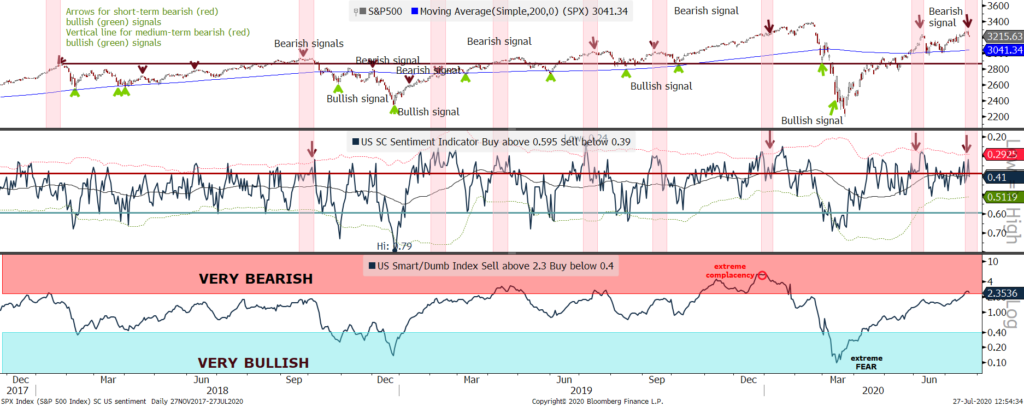
To finish, just a small short term warning ! Tactically, our US SC sentiment indicator is forecasting a short term pause in the exuberant rise of global equities. The chart below shows our current Sentiment indicators for US. The short term indicator (middle chart) gave many contrarian short signals, but more worryingly, our S/D medium term indicator just turned bearish. This is an indication to be ready to add some hedges if equities were to reverse.
Chart 5: Our short term and medium term SC US Sentiment indicators are advocating a pause
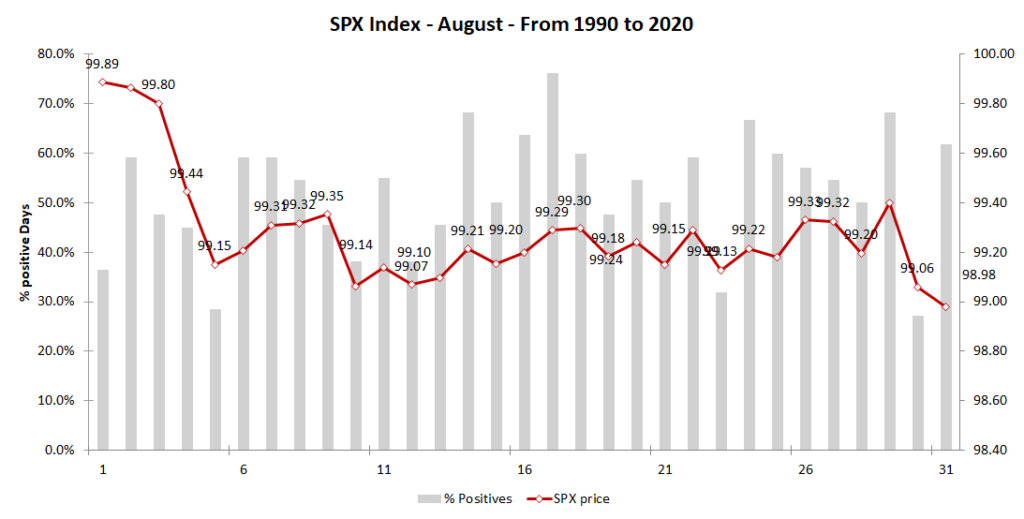
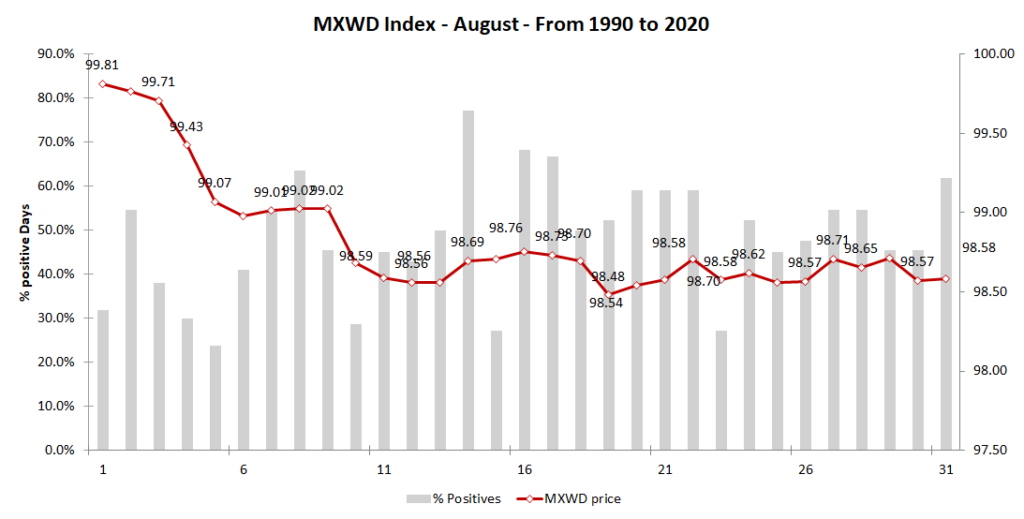
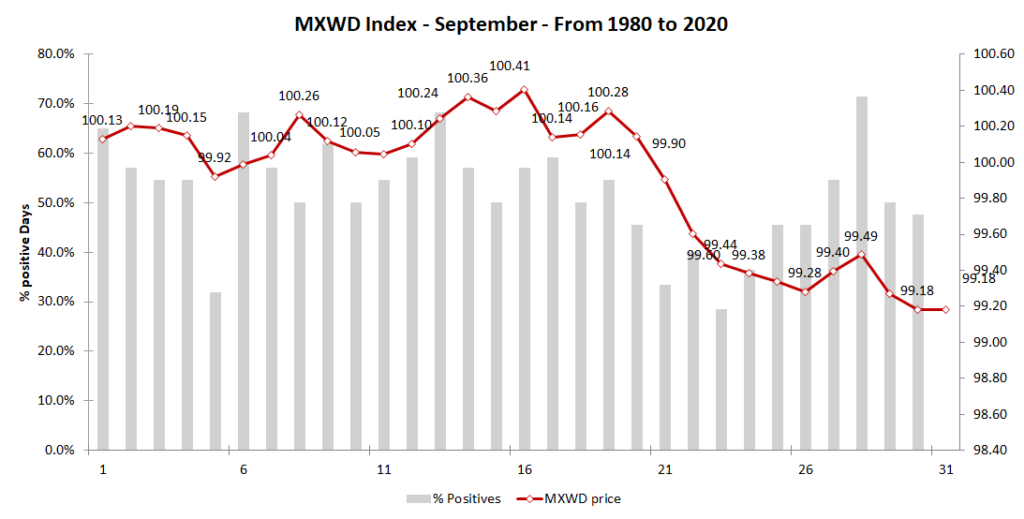
This red flag happens during the summer doldrums, whose seasonality is bearish for US and global stocks. The three charts below shows the cumulated average return of the S&P500 and global equities since 1990. US equities are down 1% in August whil Gloabl ones are done between 2 and 3% for the months of August and September. However, once and if equities pause or correct slightly, we expect a resumption of this exuberant bullish trend for the future as long as our “Circé” central banks keep us in the dreamt BubbleLand of Alice.
Chart 6: Seasonality is bearish for the S&P500 in August and global equities in August & September since 1990
Disclaimer:
This marketing document is issued by Stouff Capital. It is neither directed to, nor intended for distribution or use by, any person or entity who is a citizen or resident of or located in any locality, state, country or jurisdiction where such distribution, publication, availability or use would be contrary to law or regulation.
The information and data presented in this document are not to be considered as an offer or solicitation to buy, sell or subscribe to any securities or financial instruments. Information, opinions and estimates contained in this document reflect a judgment at the original date of publication and are subject to change without notice. Any reference to benchmarks/indices herein are provided for information purposes only. No benchmark/index is directly comparable to the investment objectives, strategy or universe of Stouff Capital. For further information on the index please refer to the website of its service provider.
Stouff Capital has not taken any steps to ensure that the securities referred to in this document are suitable for any particular investor and this document is not to be relied upon in substitution for the exercise of independent judgment. Tax treatment depends on the individual circumstances of each investor and may be subject to change in the future. Before making any investment decision, investors are recommended to ascertain if this investment is suitable for them in light of their financial knowledge and experience, investment goals and financial situation, and/or to obtain specific advice from an industry professional.
The value and income of any of the securities or financial instruments mentioned in this document may fall as well as rise and, as a consequence, investors may receive back less than originally invested. The investment risks described herein are not purported to be exhaustive. Past performance is neither guarantee nor a reliable indicator of future results. Performance data does not include the commissions and fees charged at the time of subscribing for or redeeming shares. Investors investing in investments and/or treasury products denominated in foreign currency should be aware of the risk of exchange rate fluctuations that may cause loss of principal when foreign currency is converted to the investors home currency.
This document is confidential and intended solely for the use of the recipient. It must not be reproduced, distributed or published in whole or in part by any recipient for any purpose without the prior consent of Stouff Capital.